New article
Recently updated
Selecting and comparing monitoring data

Who is this article for?
Users who want to compare historical data.
Administrators or all users can access this functionality.
This tutorial guides you through the selection of your monitors and different parameters for better comparison.
You will learn how to adjust select one or multiple monitors, parameters, and zoom between time ranges to analyse and compare environmental data effectively.
Selecting and comparing monitoring data
Log into the system.
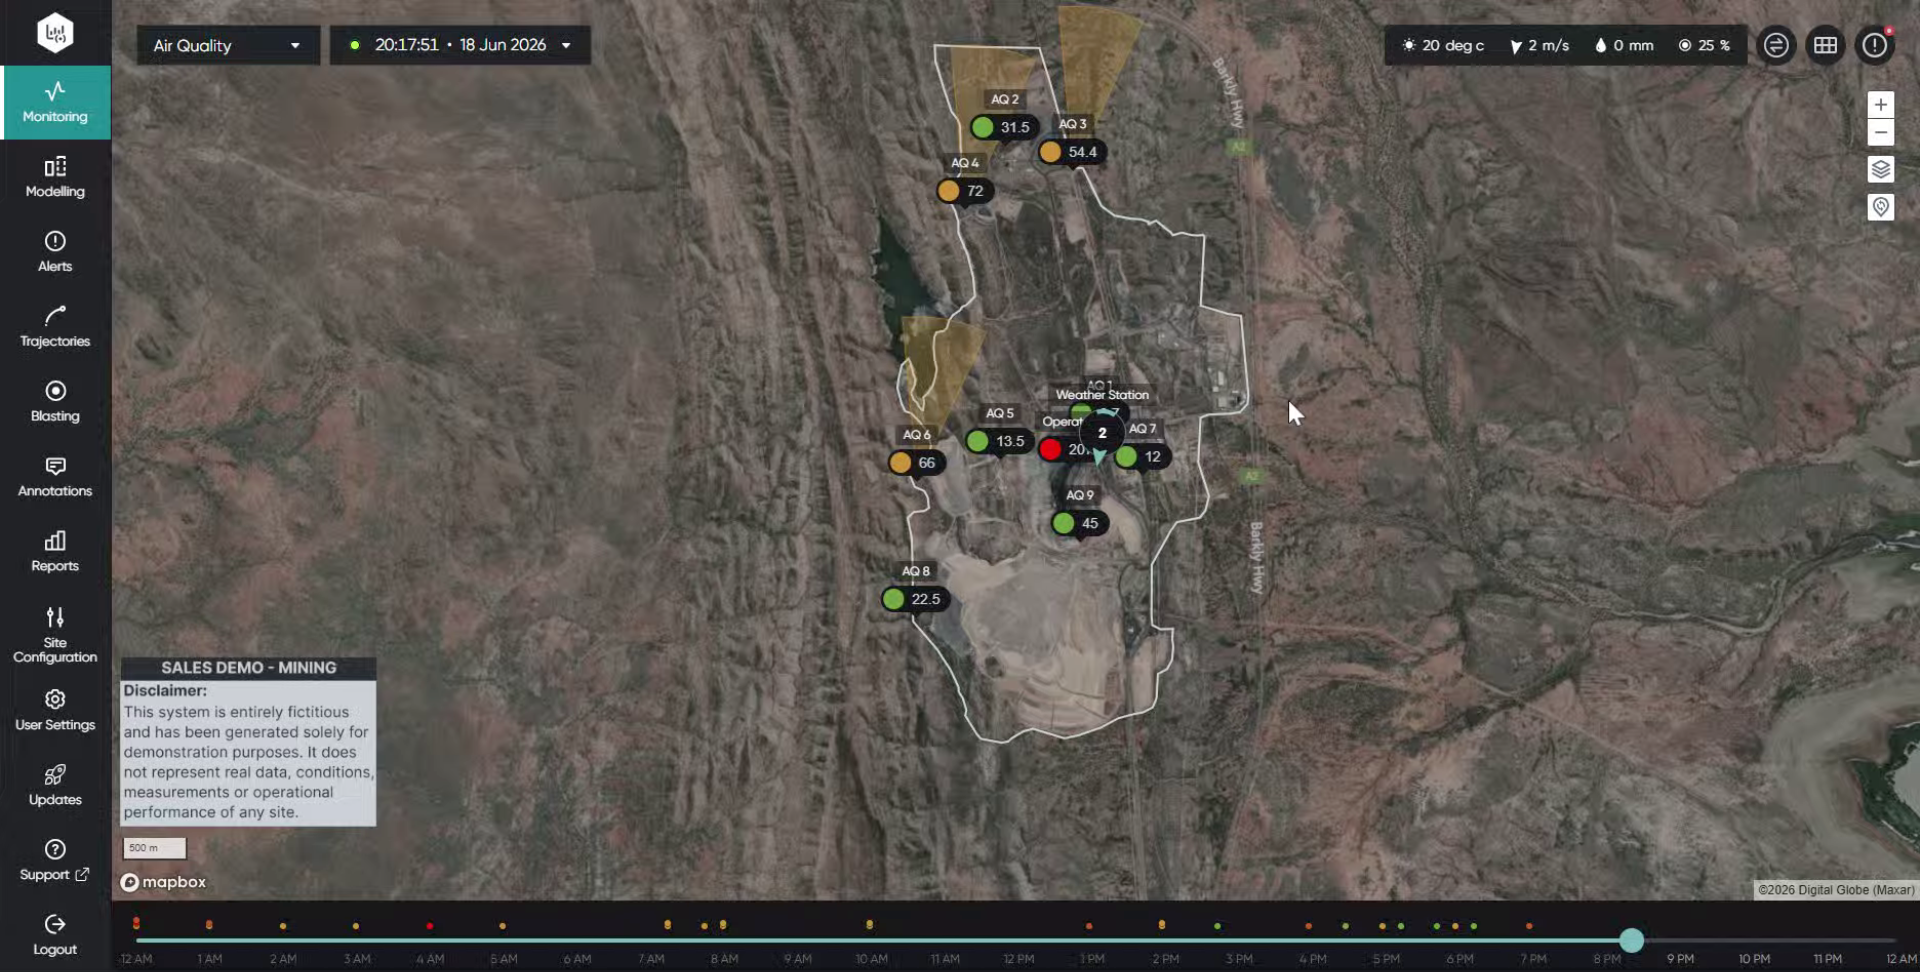
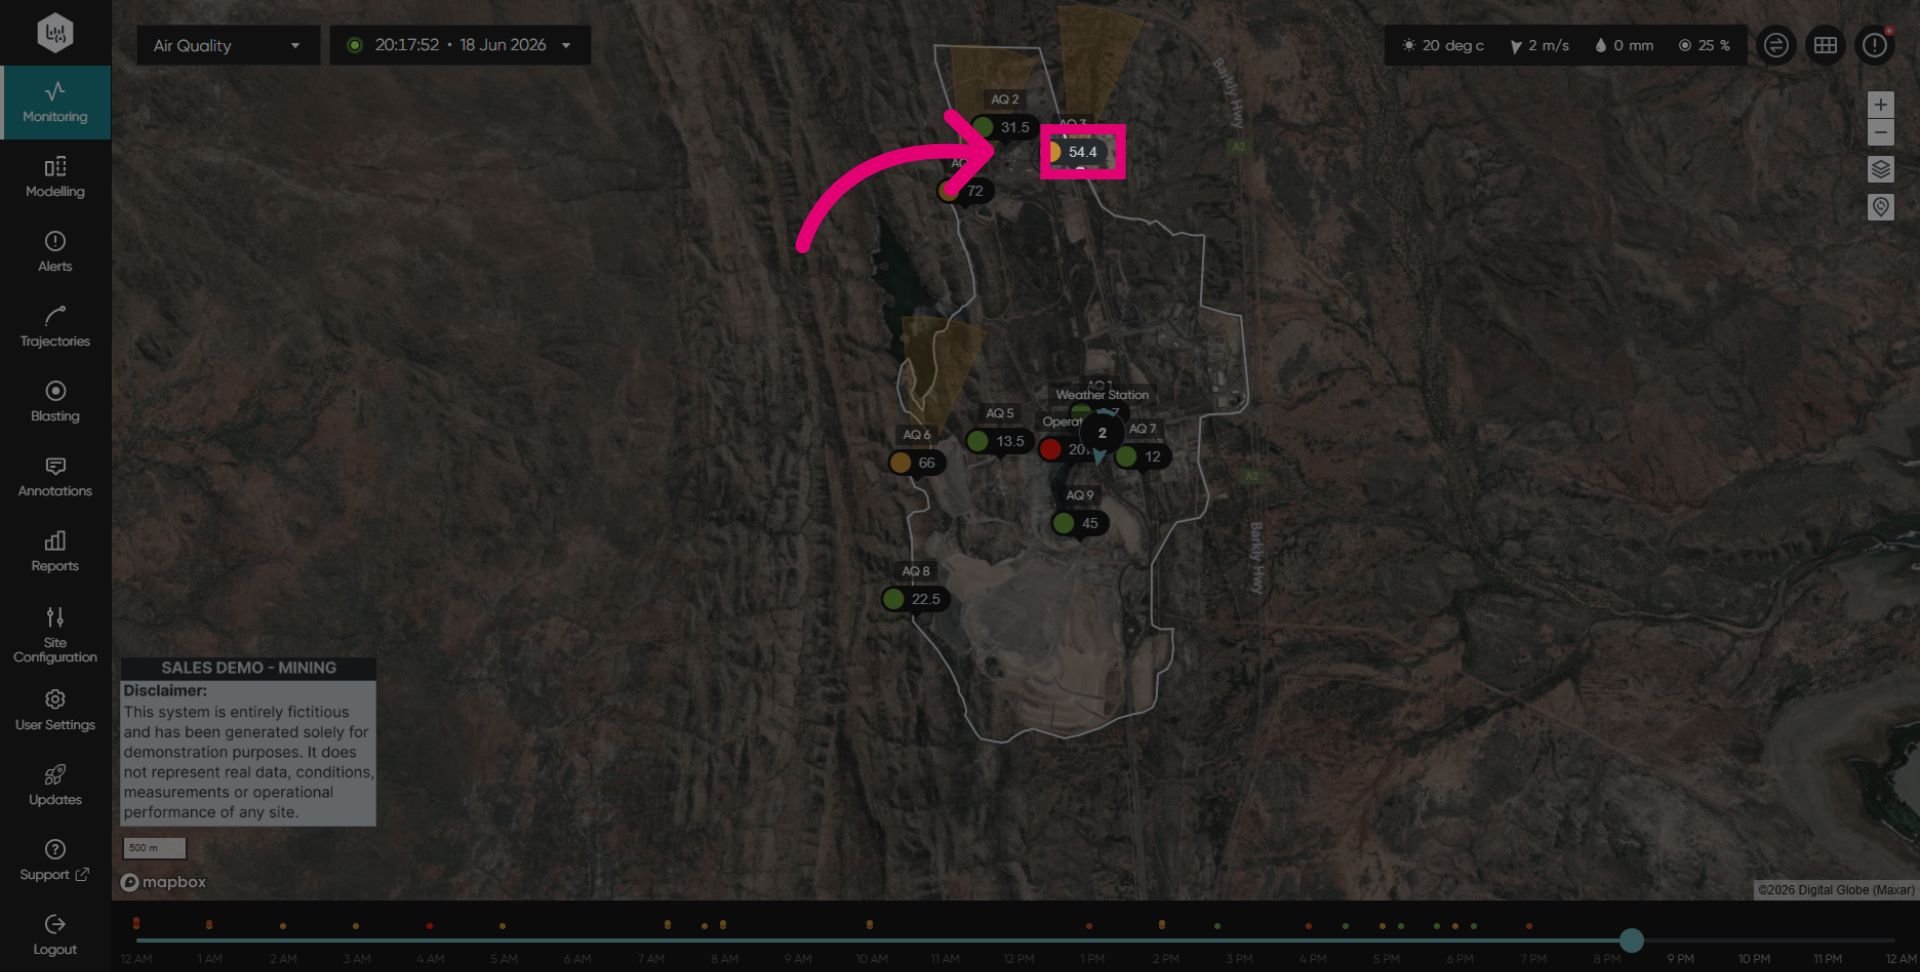
Click on your desired monitor to see all the parameter readings.
Click on the parameter or parameters you would like to see displayed in a graph.
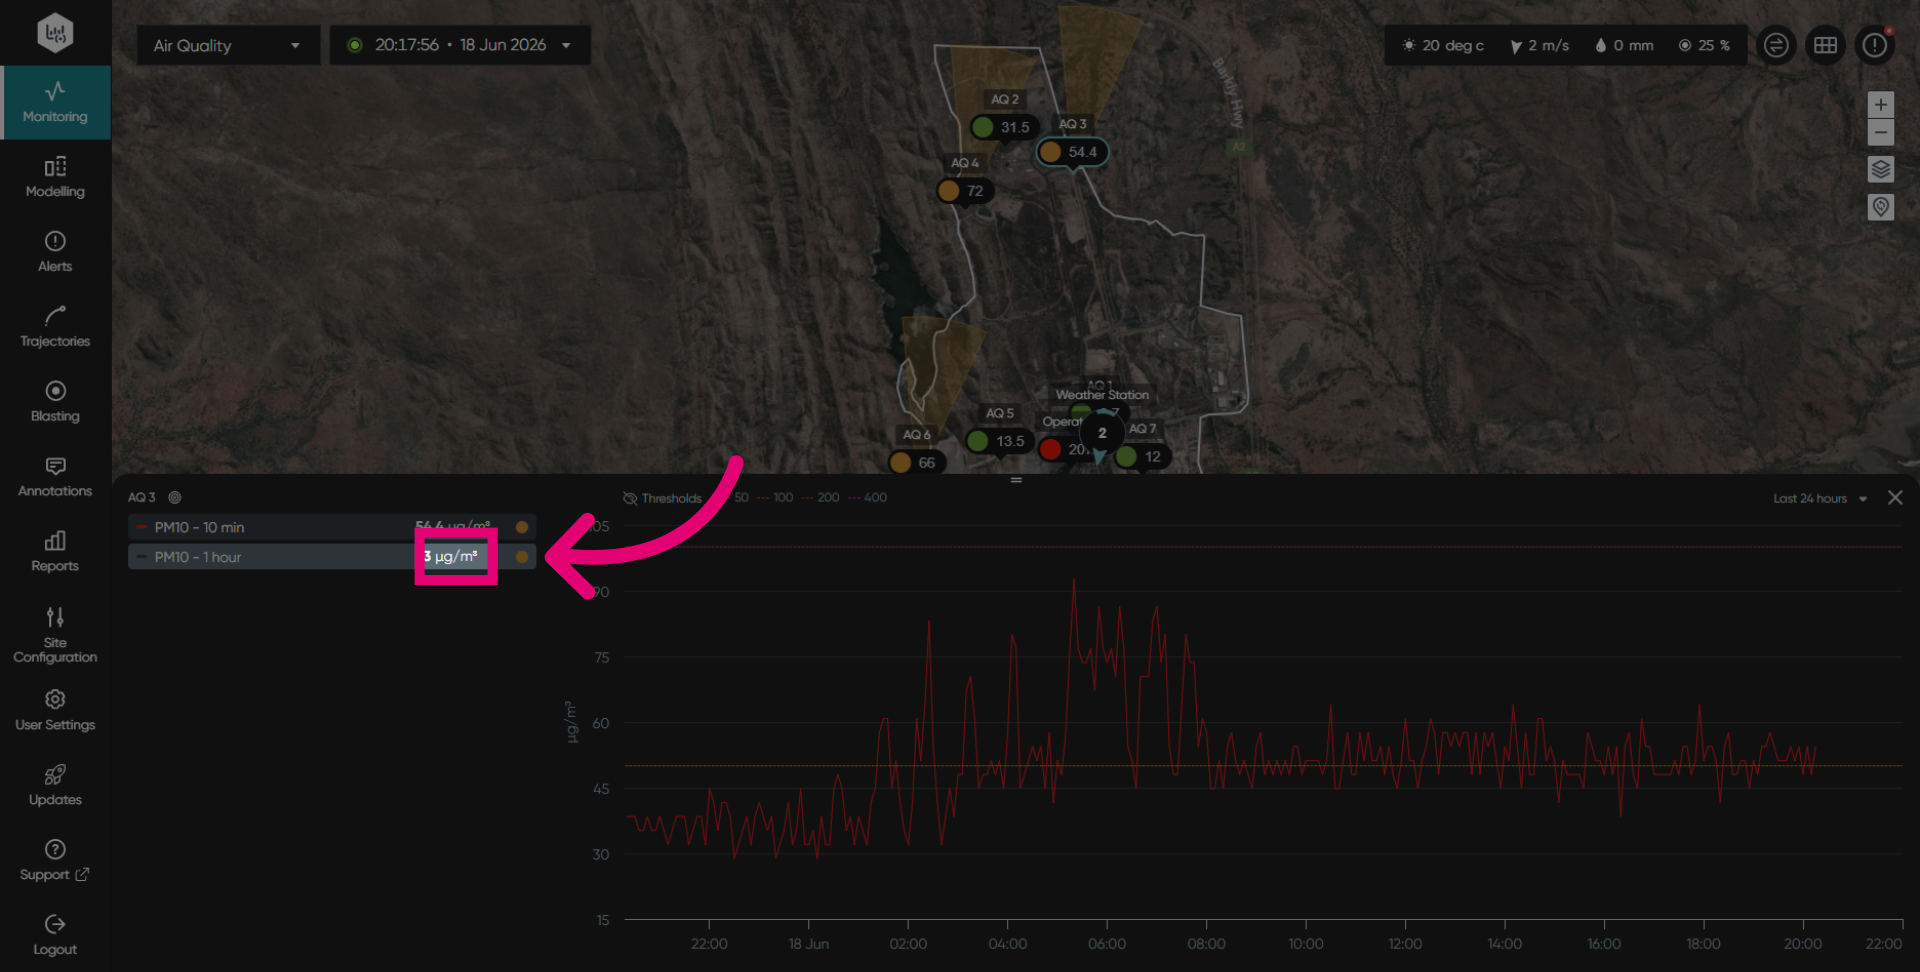
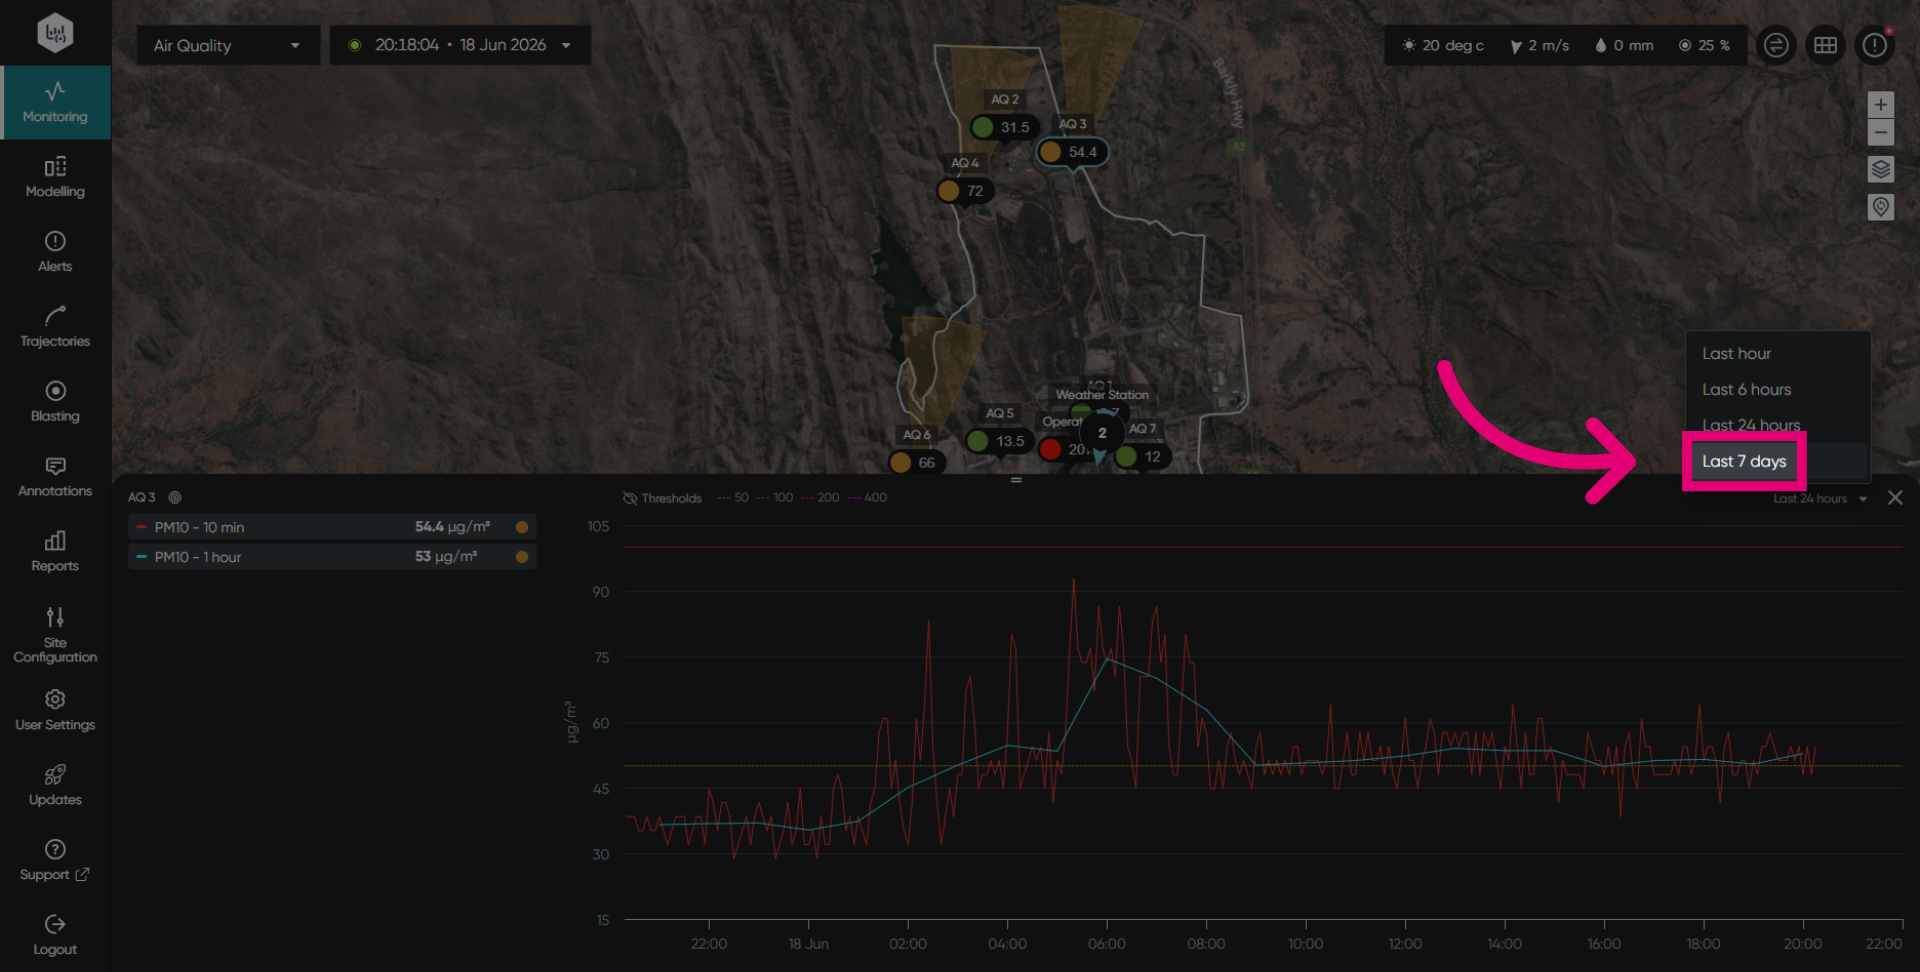
Choose from the last hour, 6 hours, 24 hours, or seven days to set your time range.
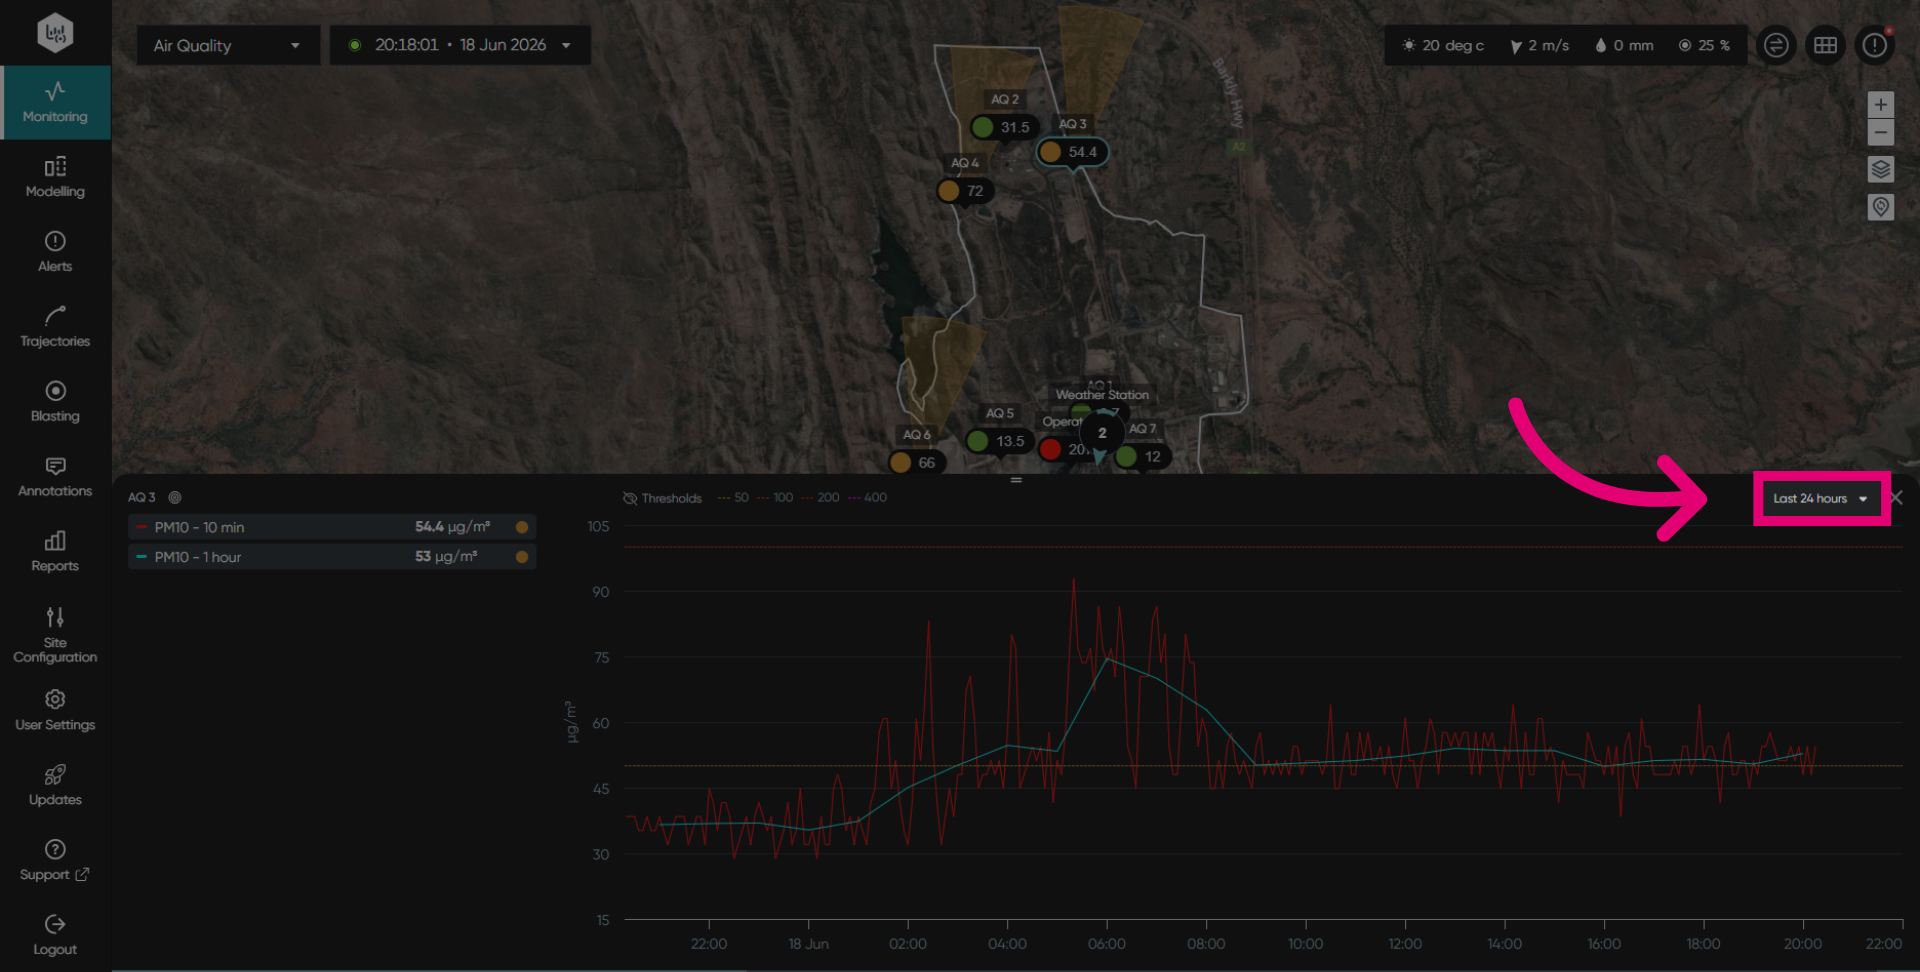
View the readings during the time range selected from the dropdown list.
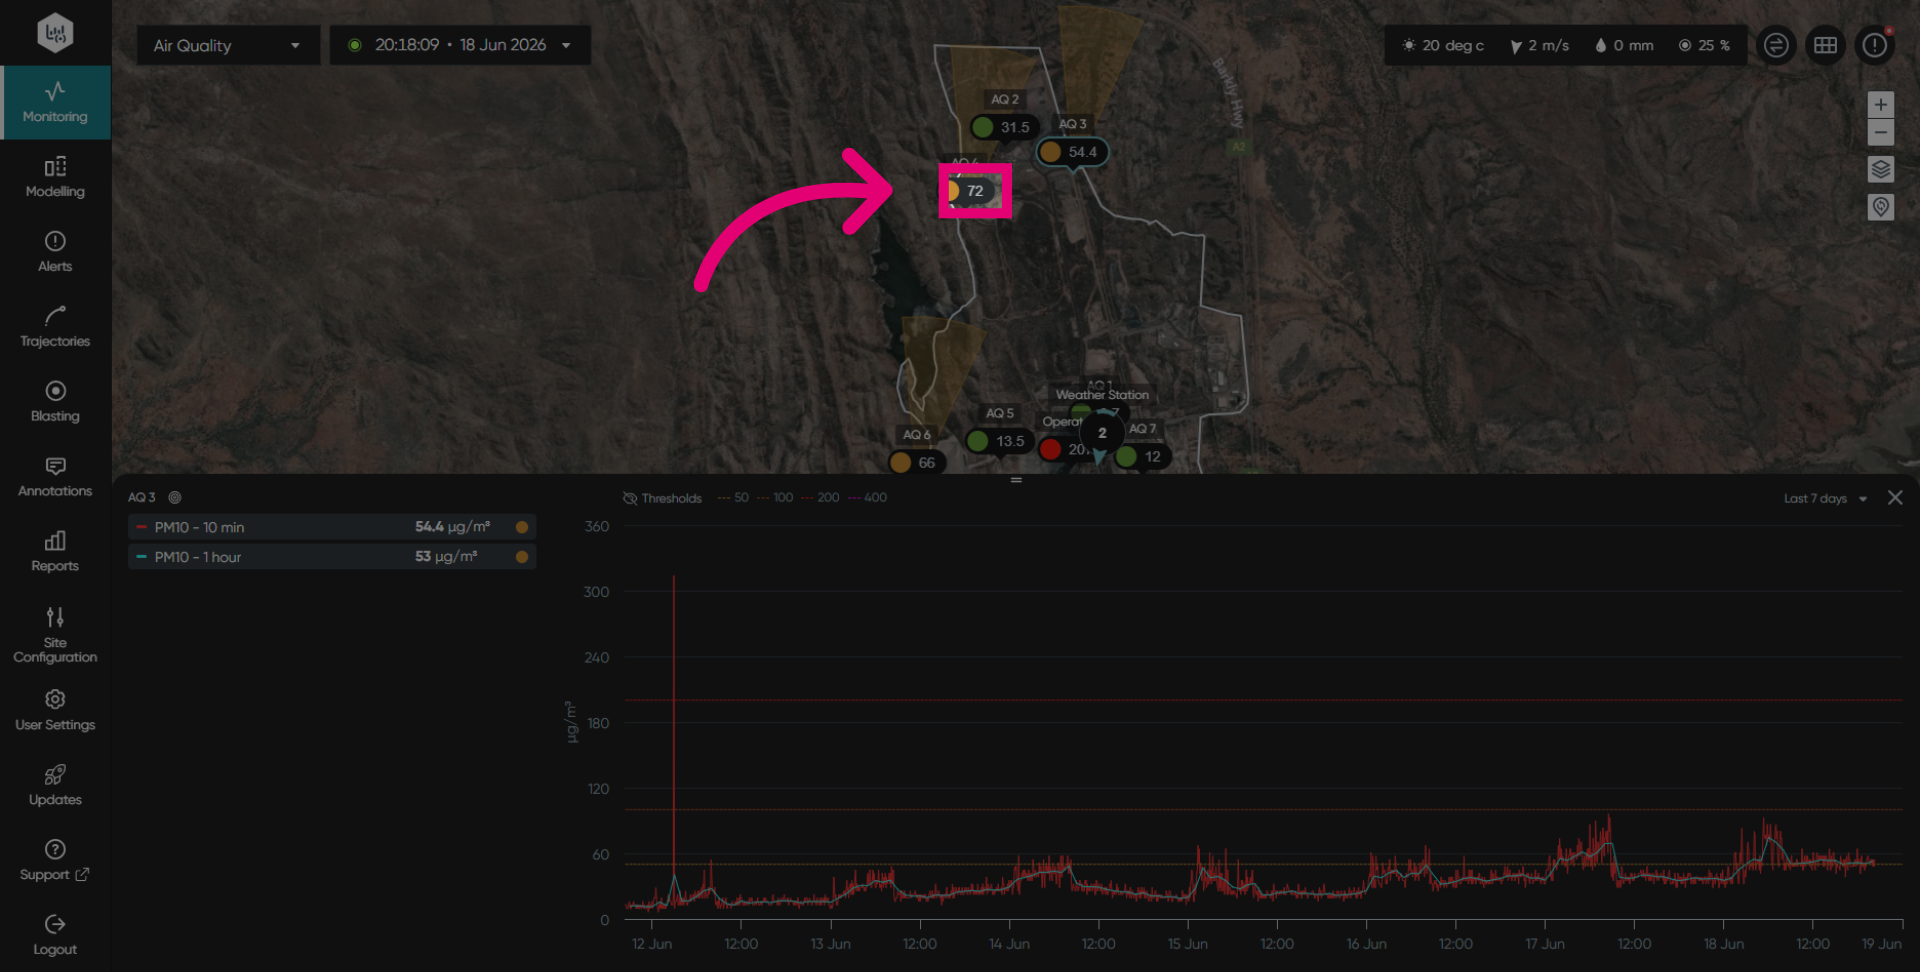
Select a second monitor to add to the graph for a comparison.
Add several monitors simultaneously as needed.
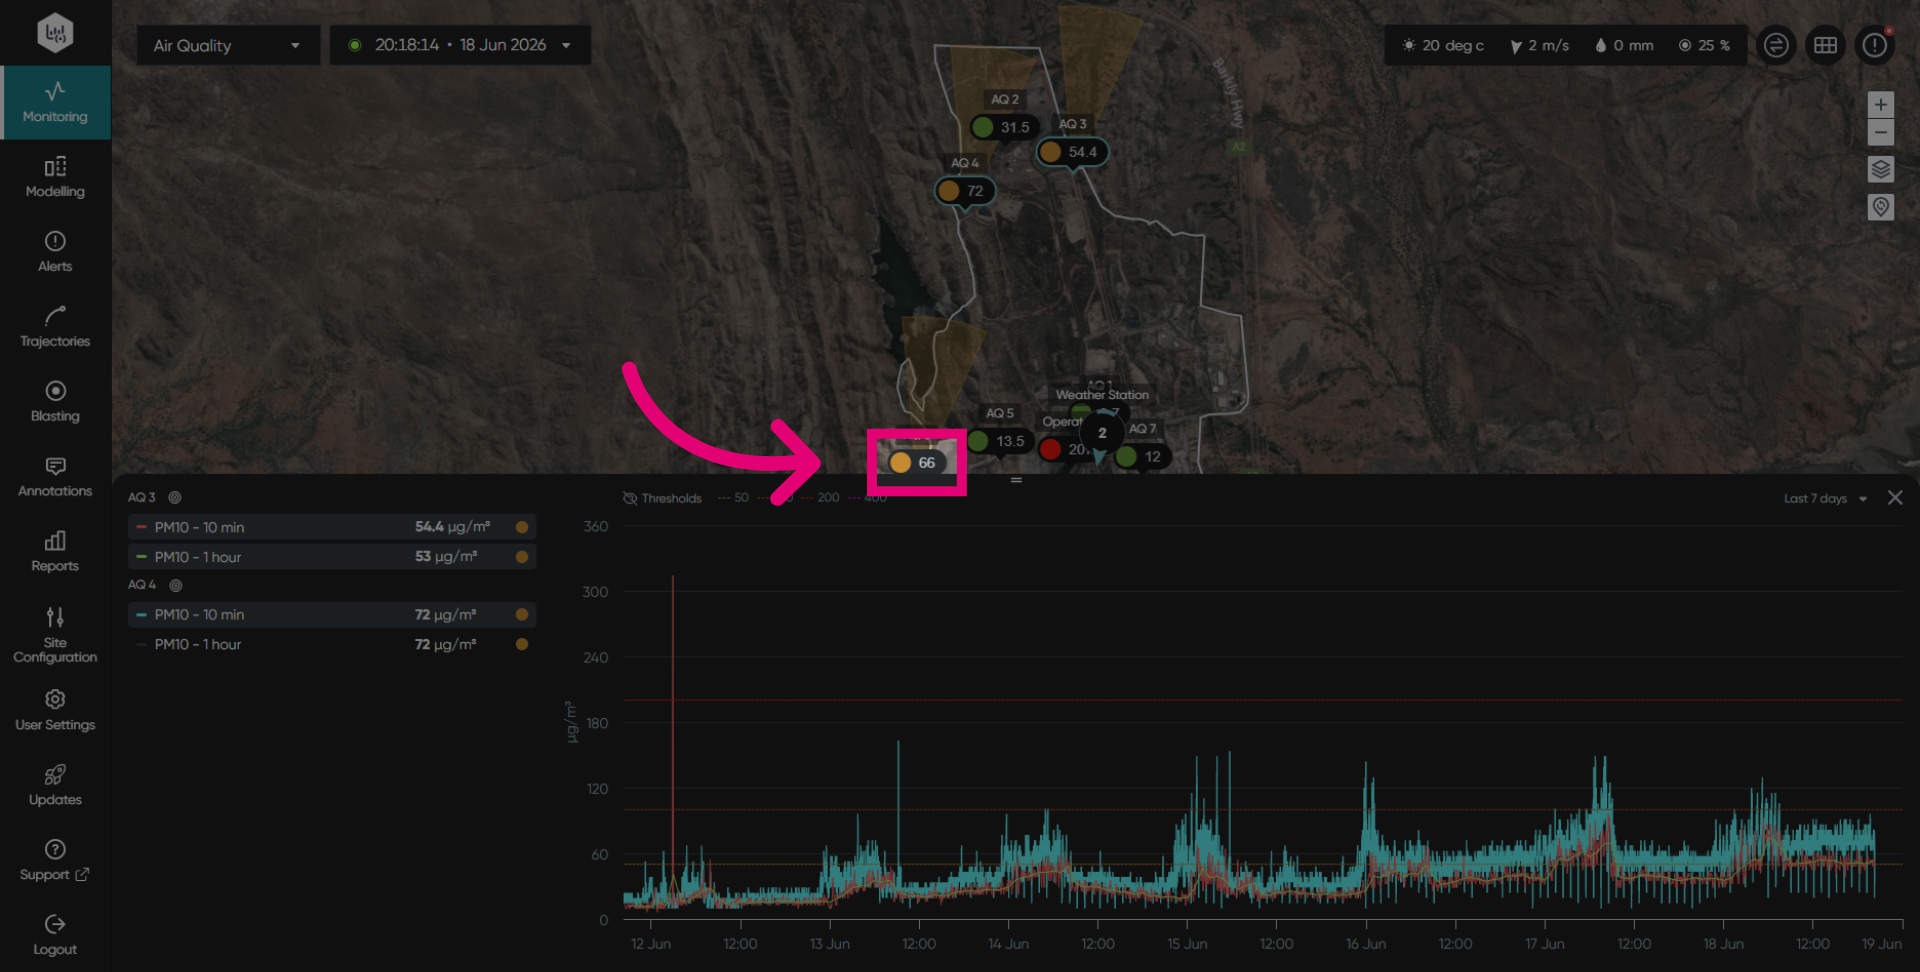
Select the parameters in common from the selected monitors to display in the graph.
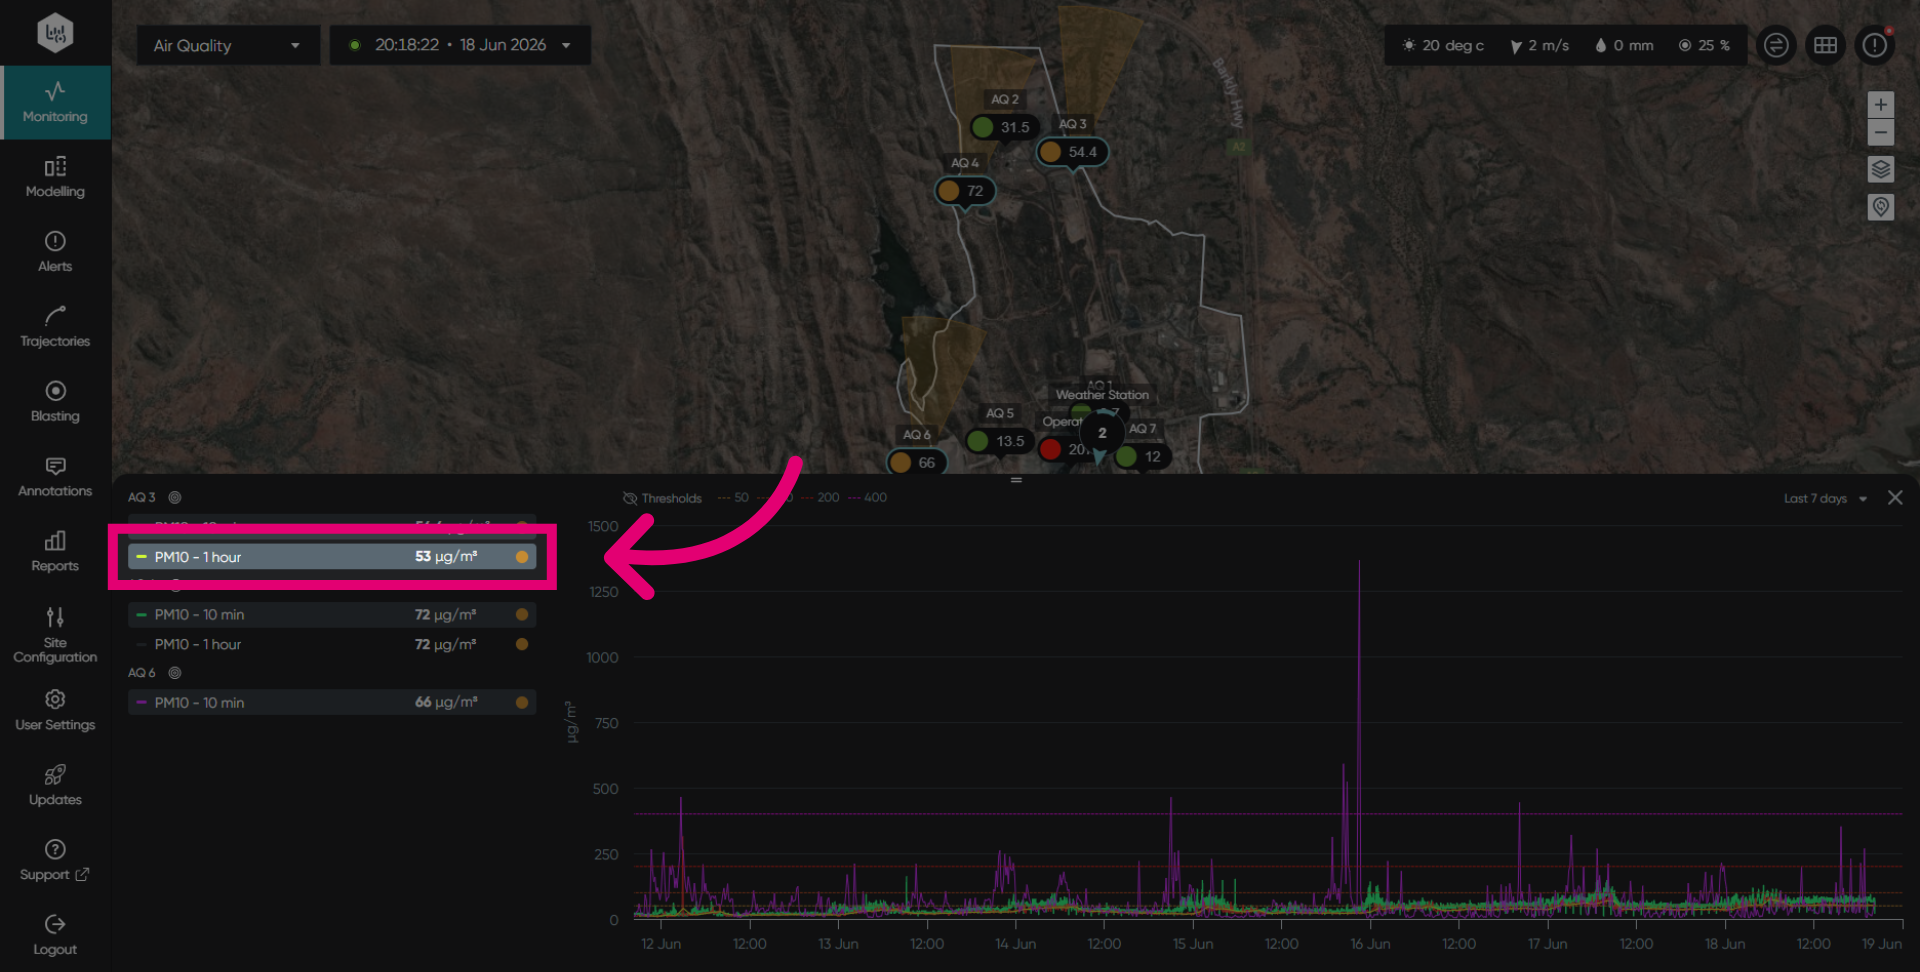
Expand the graph by dragging up the button in the centre.
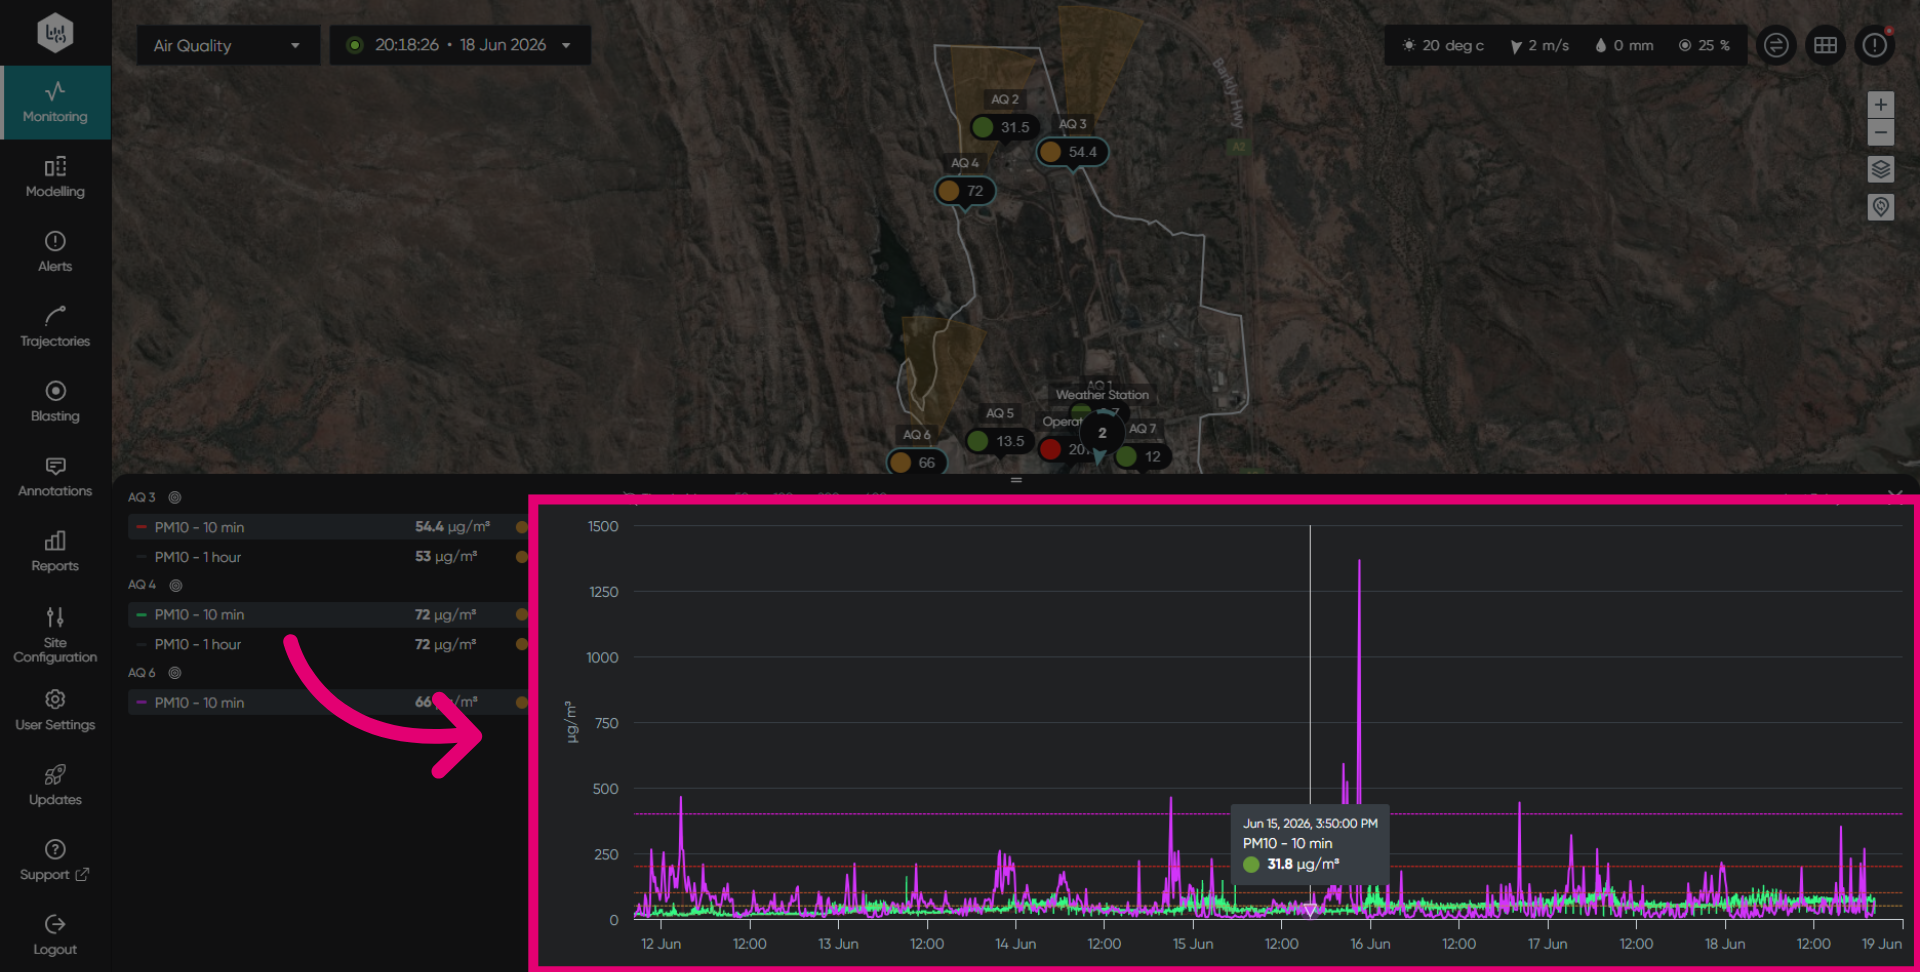
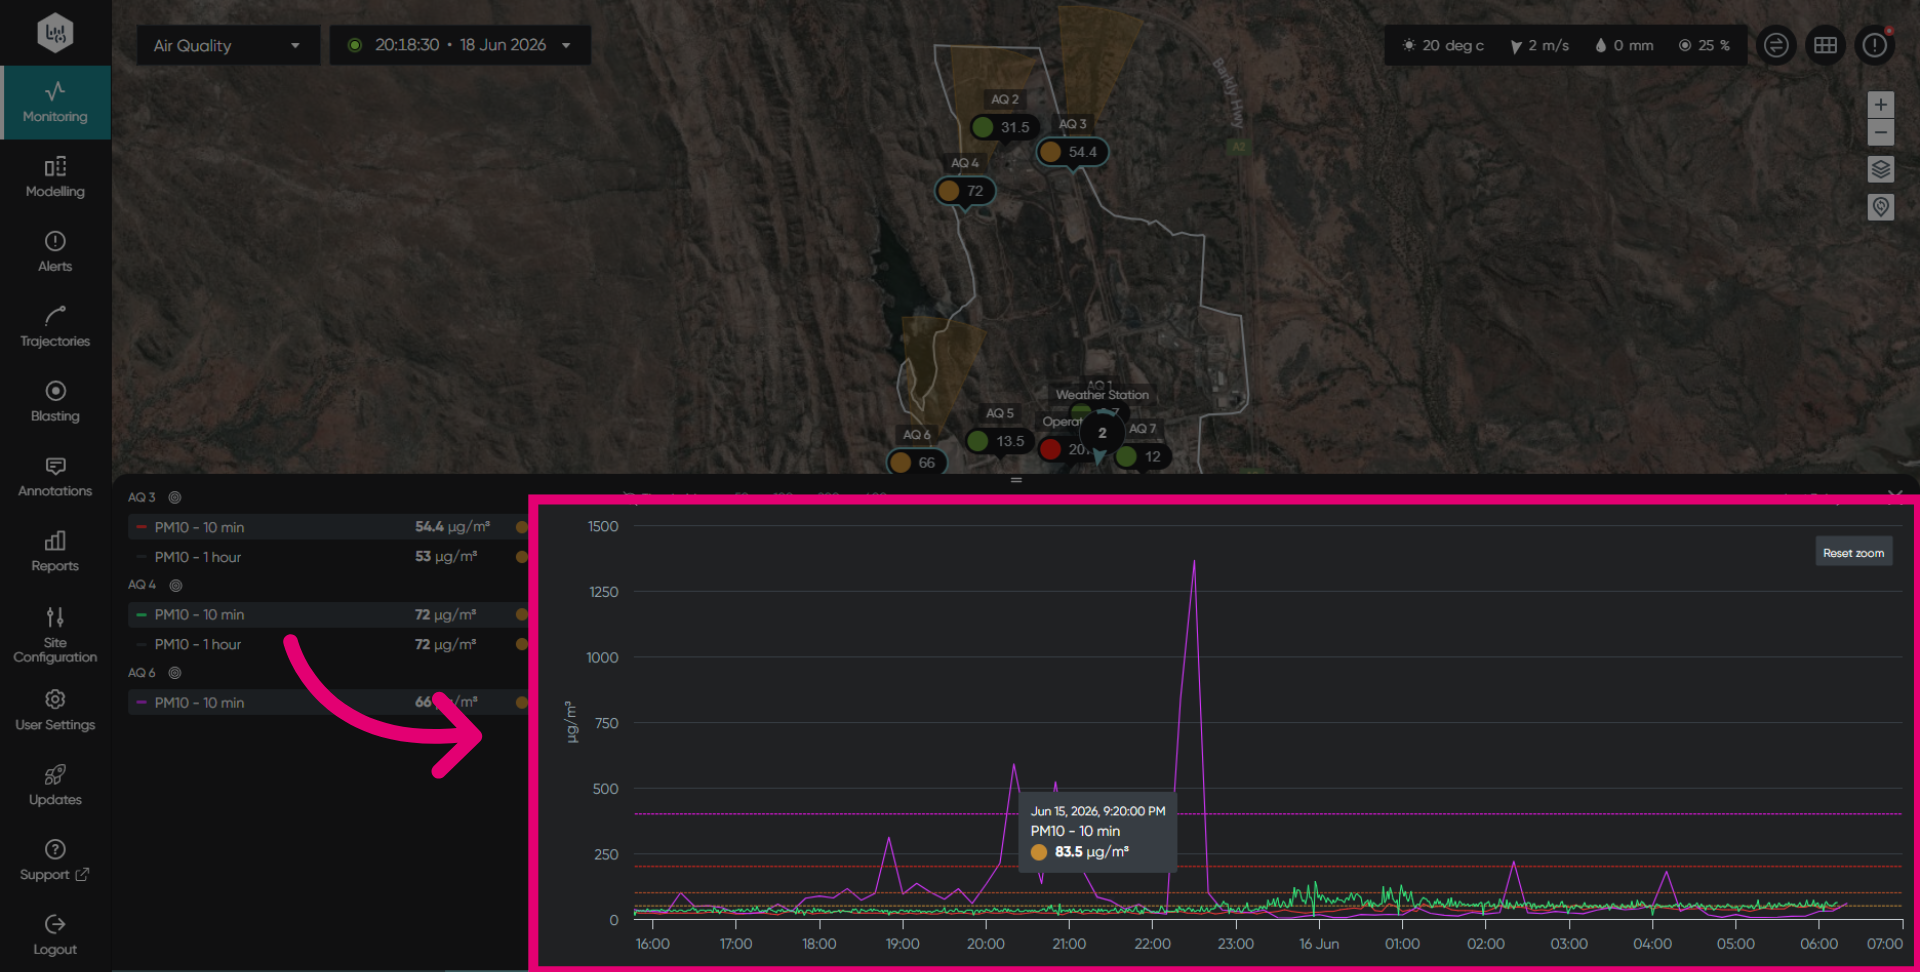
Zoom in and out within the graph to investigate the peaks in the data more closely.
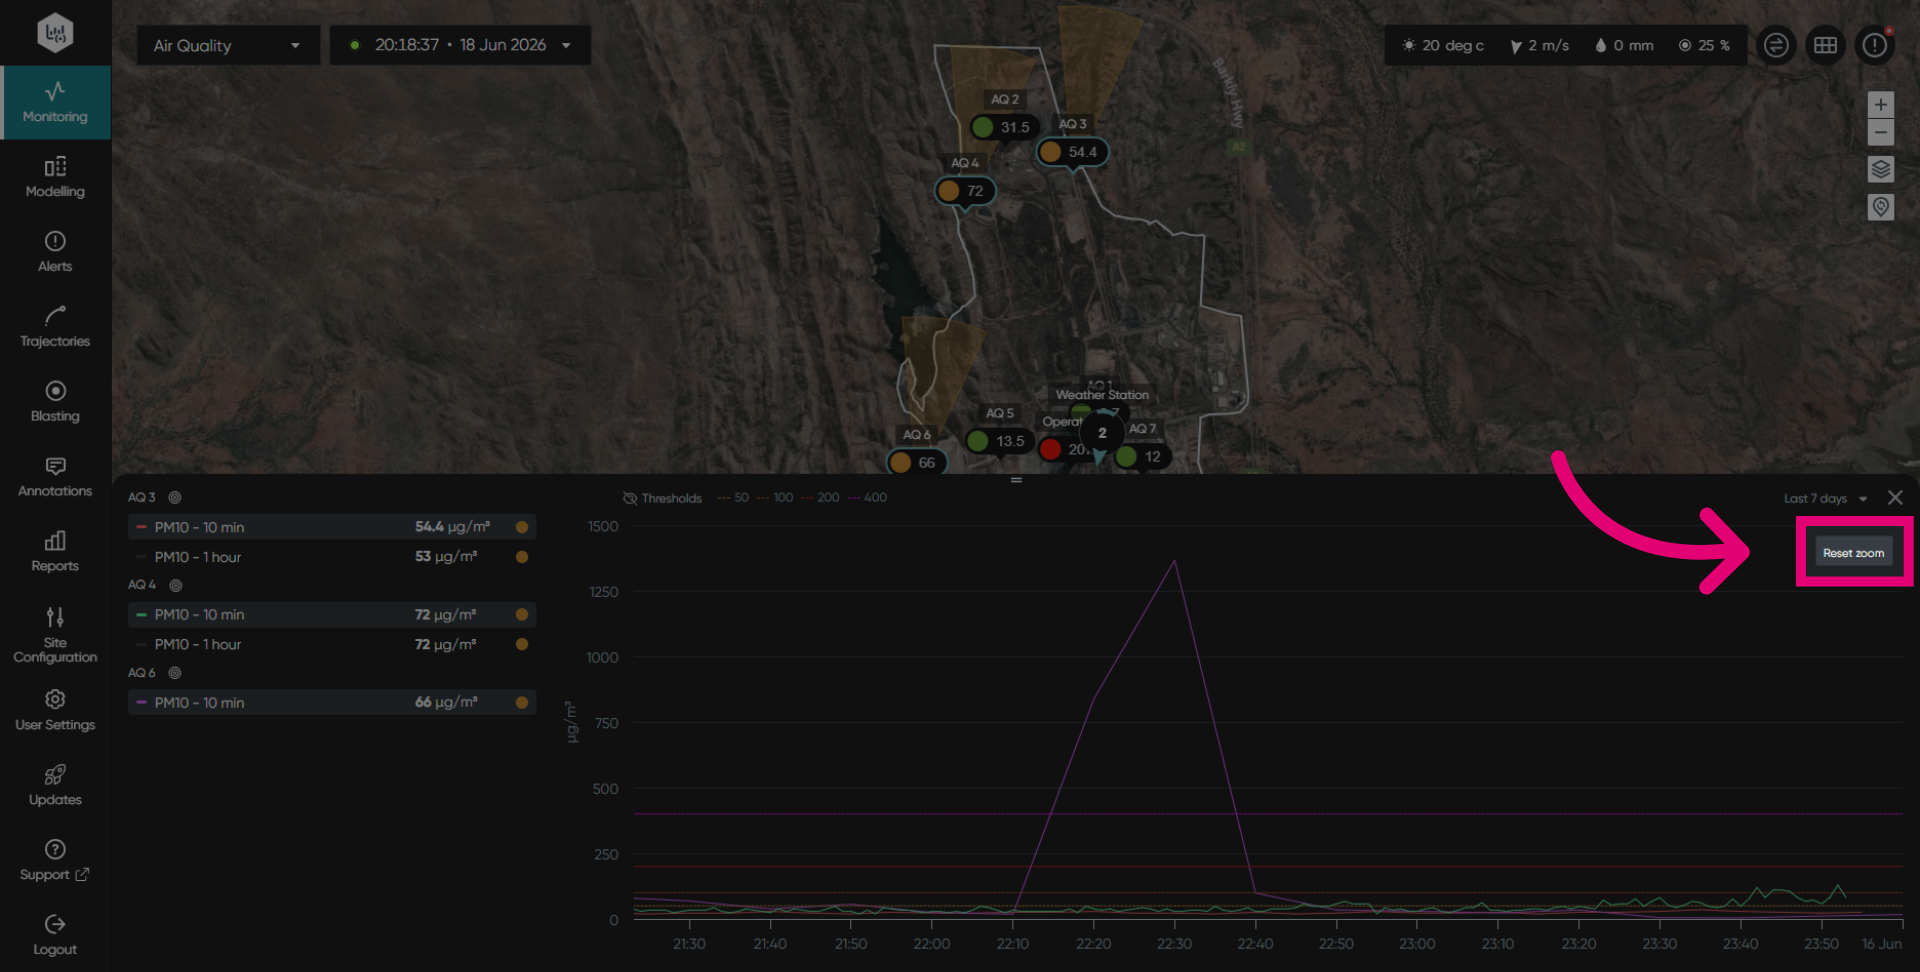
Reset the zoom level back to the original view.
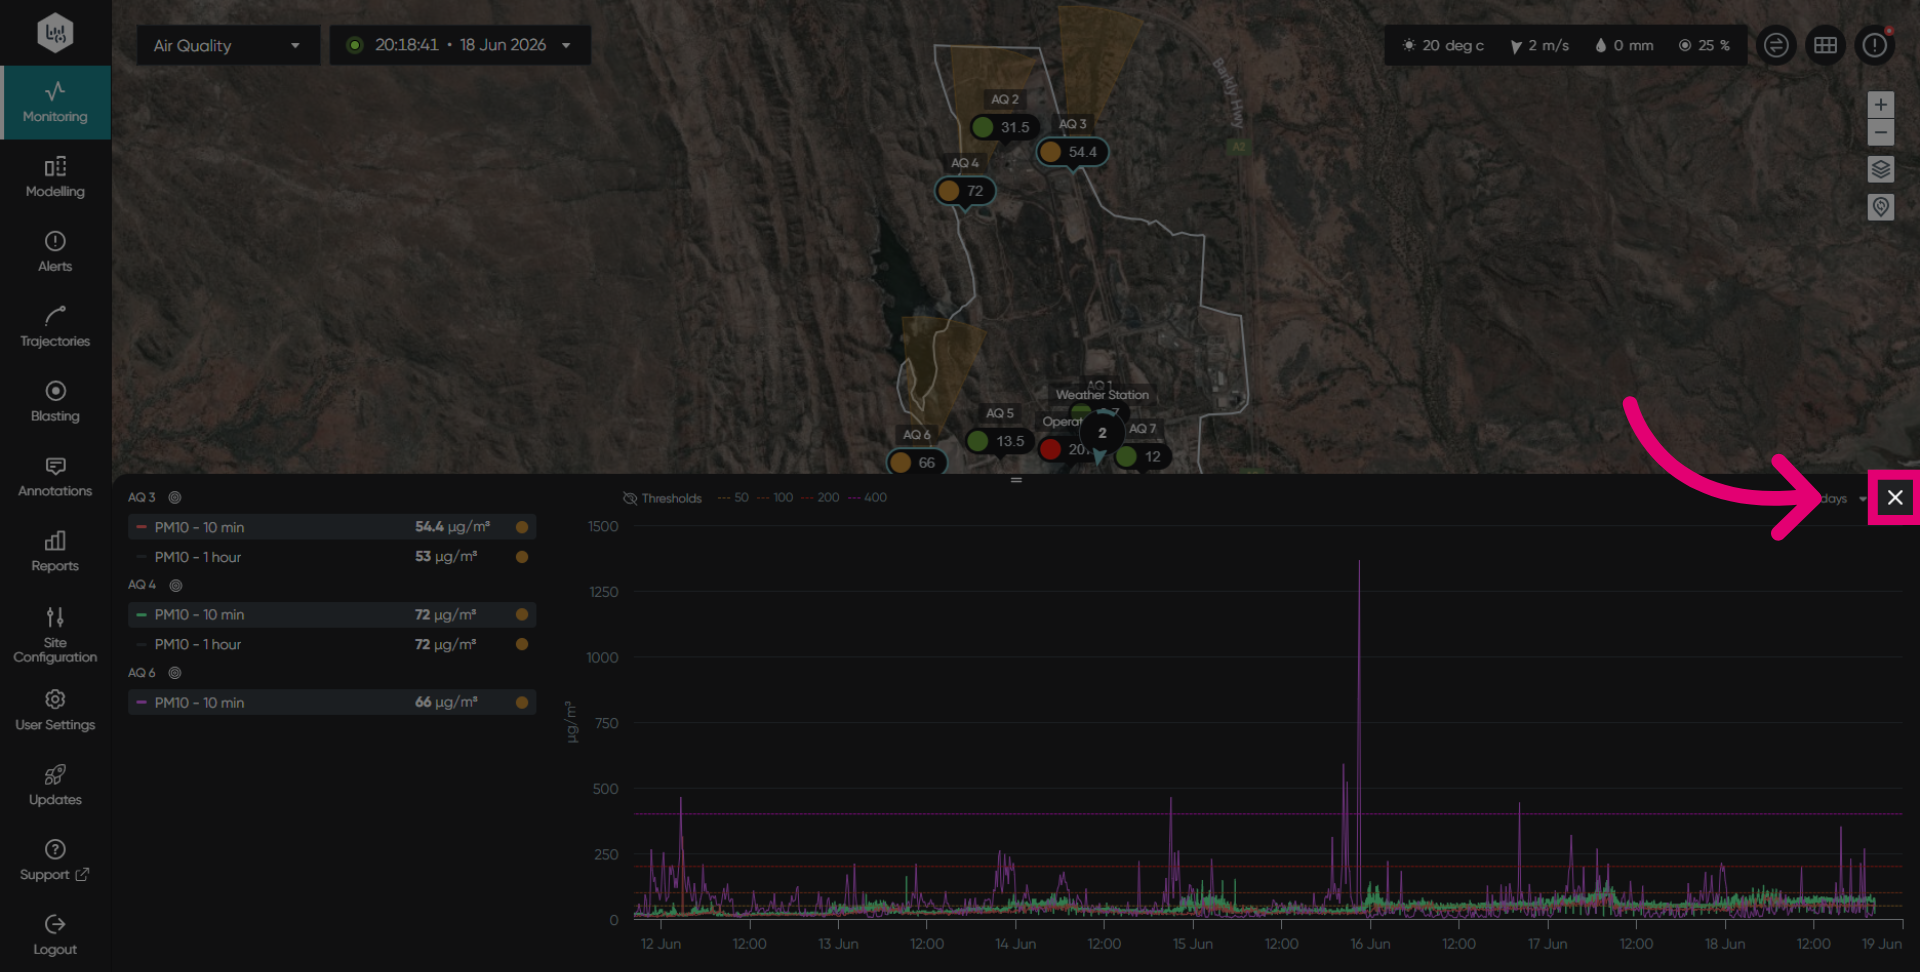
Click on the X to close the graph view.