New article
Recently updated
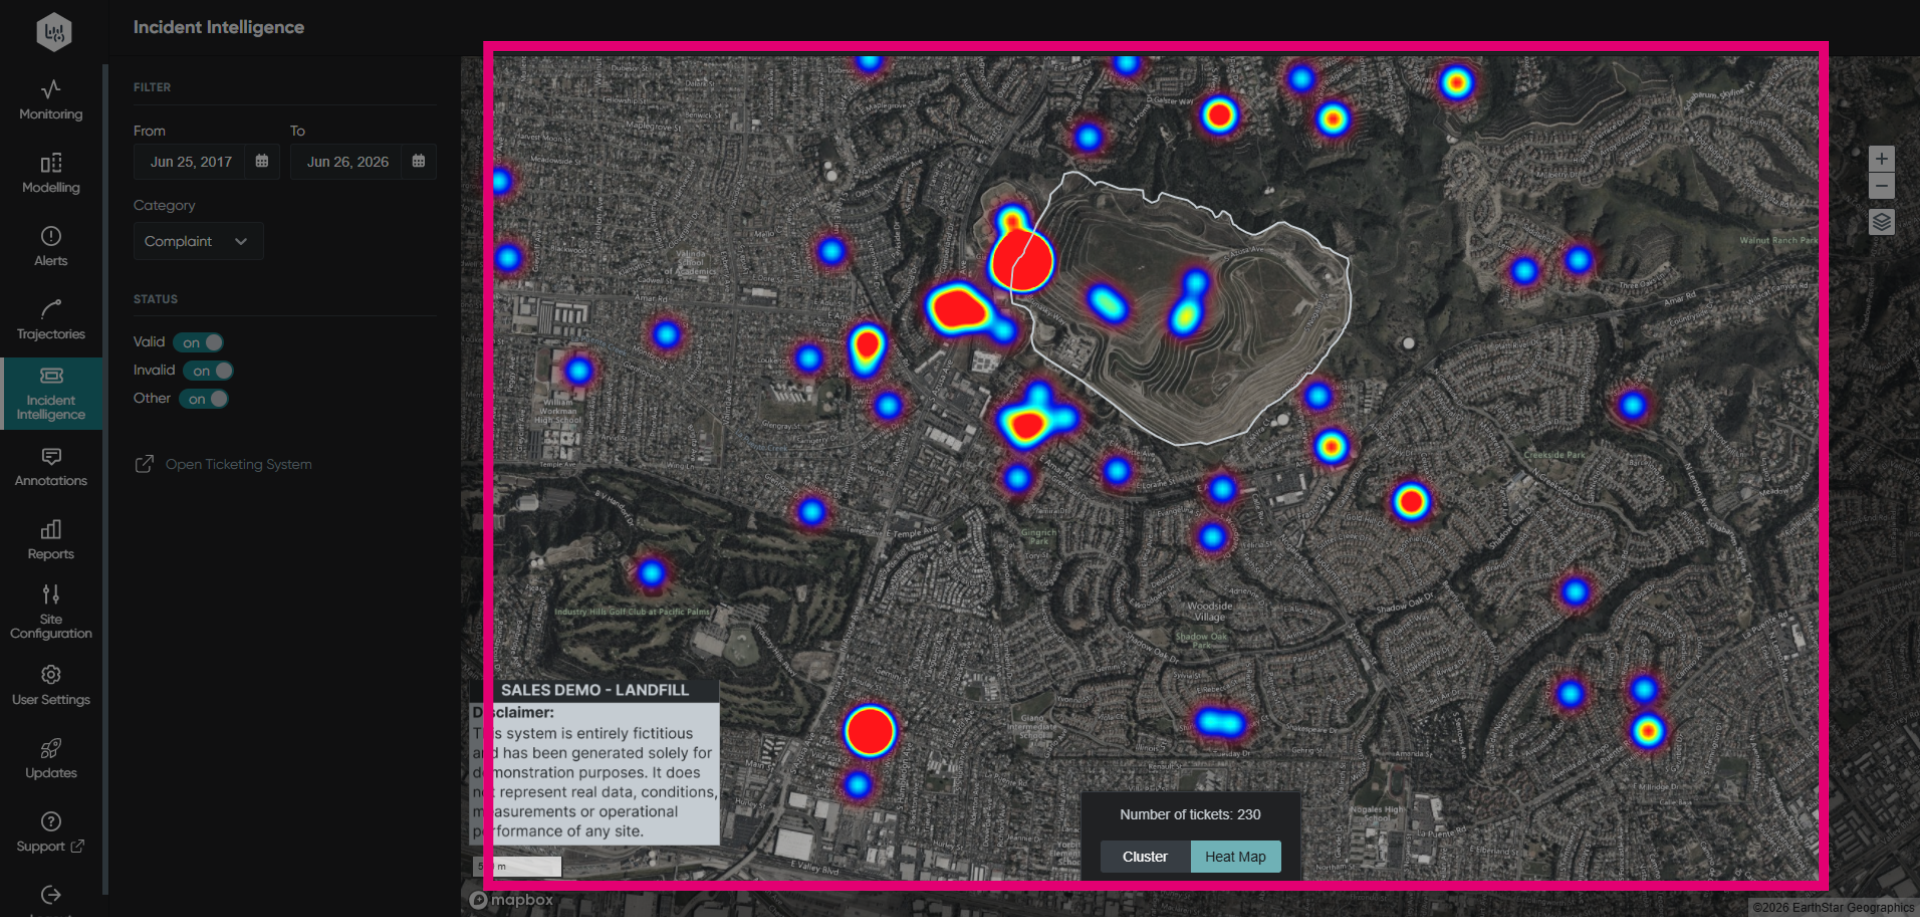
Visualizing a heat map of tickets

Who is this article for?
Users who want to visualise a heat map of tickets from incident intelligence.
Incident Intelligence module access is required.
This tutorial guides you through accessing the heat map visualization of nuisance issue from Incident Intelligence in Ideagen Envirosuite.
You will learn how to select data ranges and visualize heat maps for incident analysis.
Visualizing a heat map
To visualize the incident ticket heat map:
Log into the system.
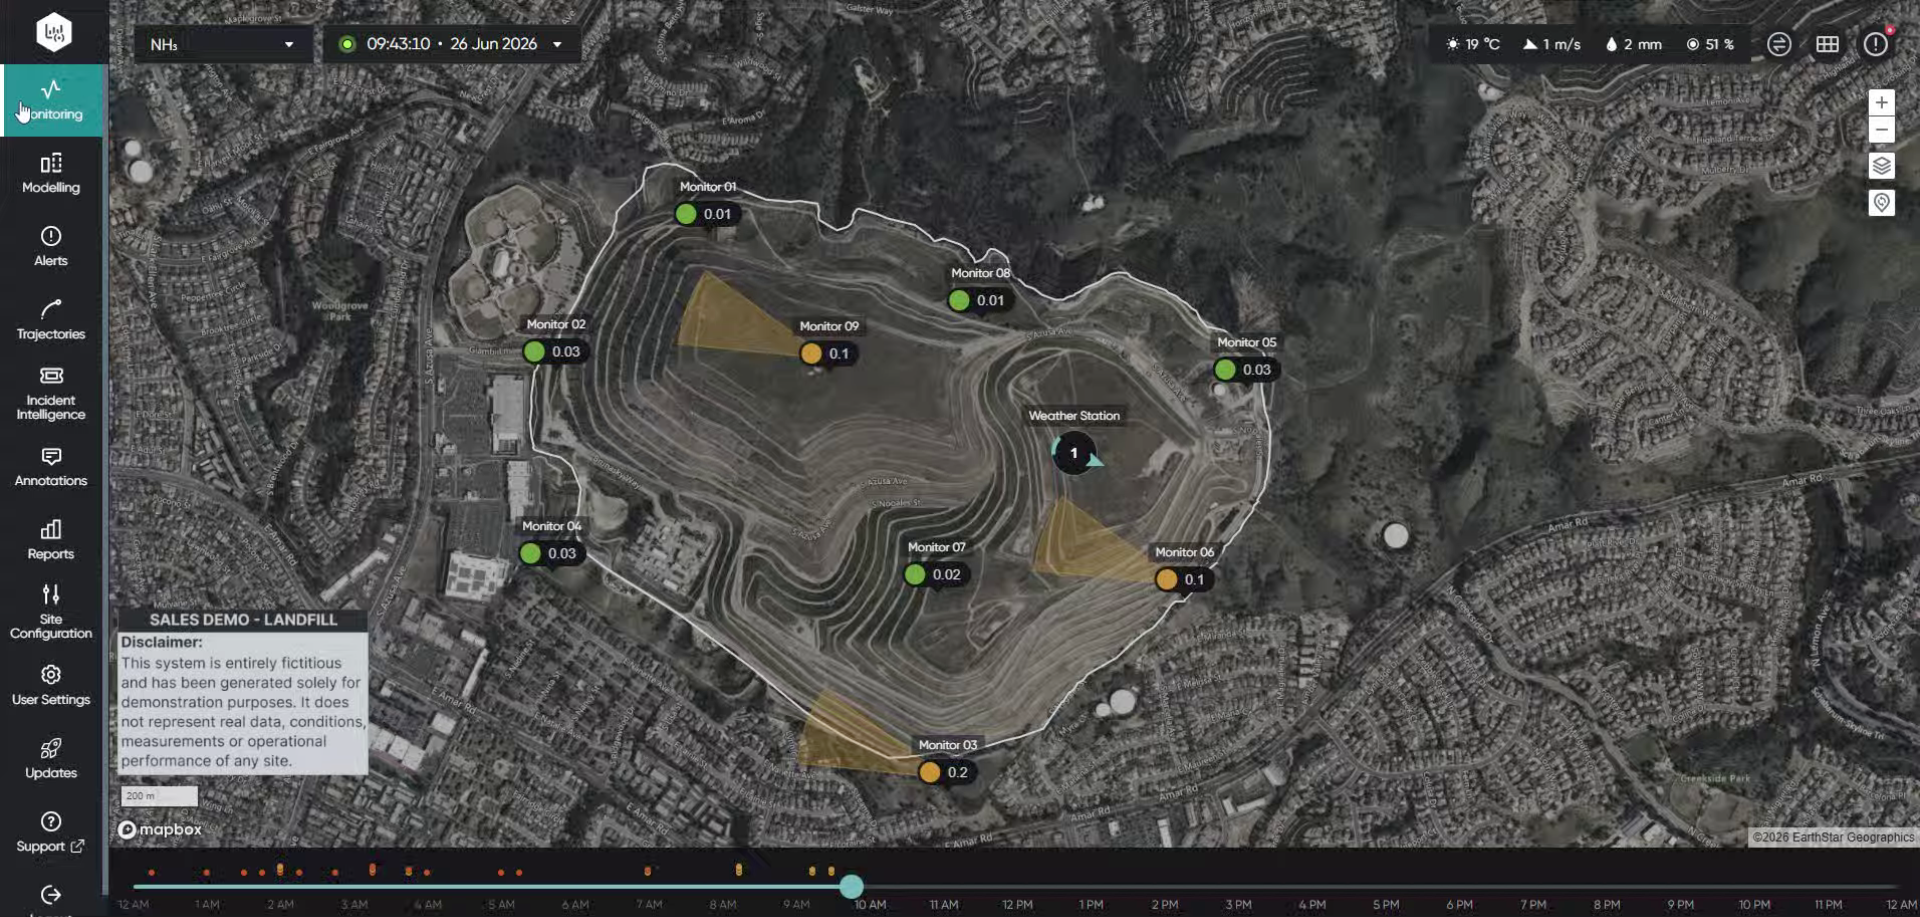
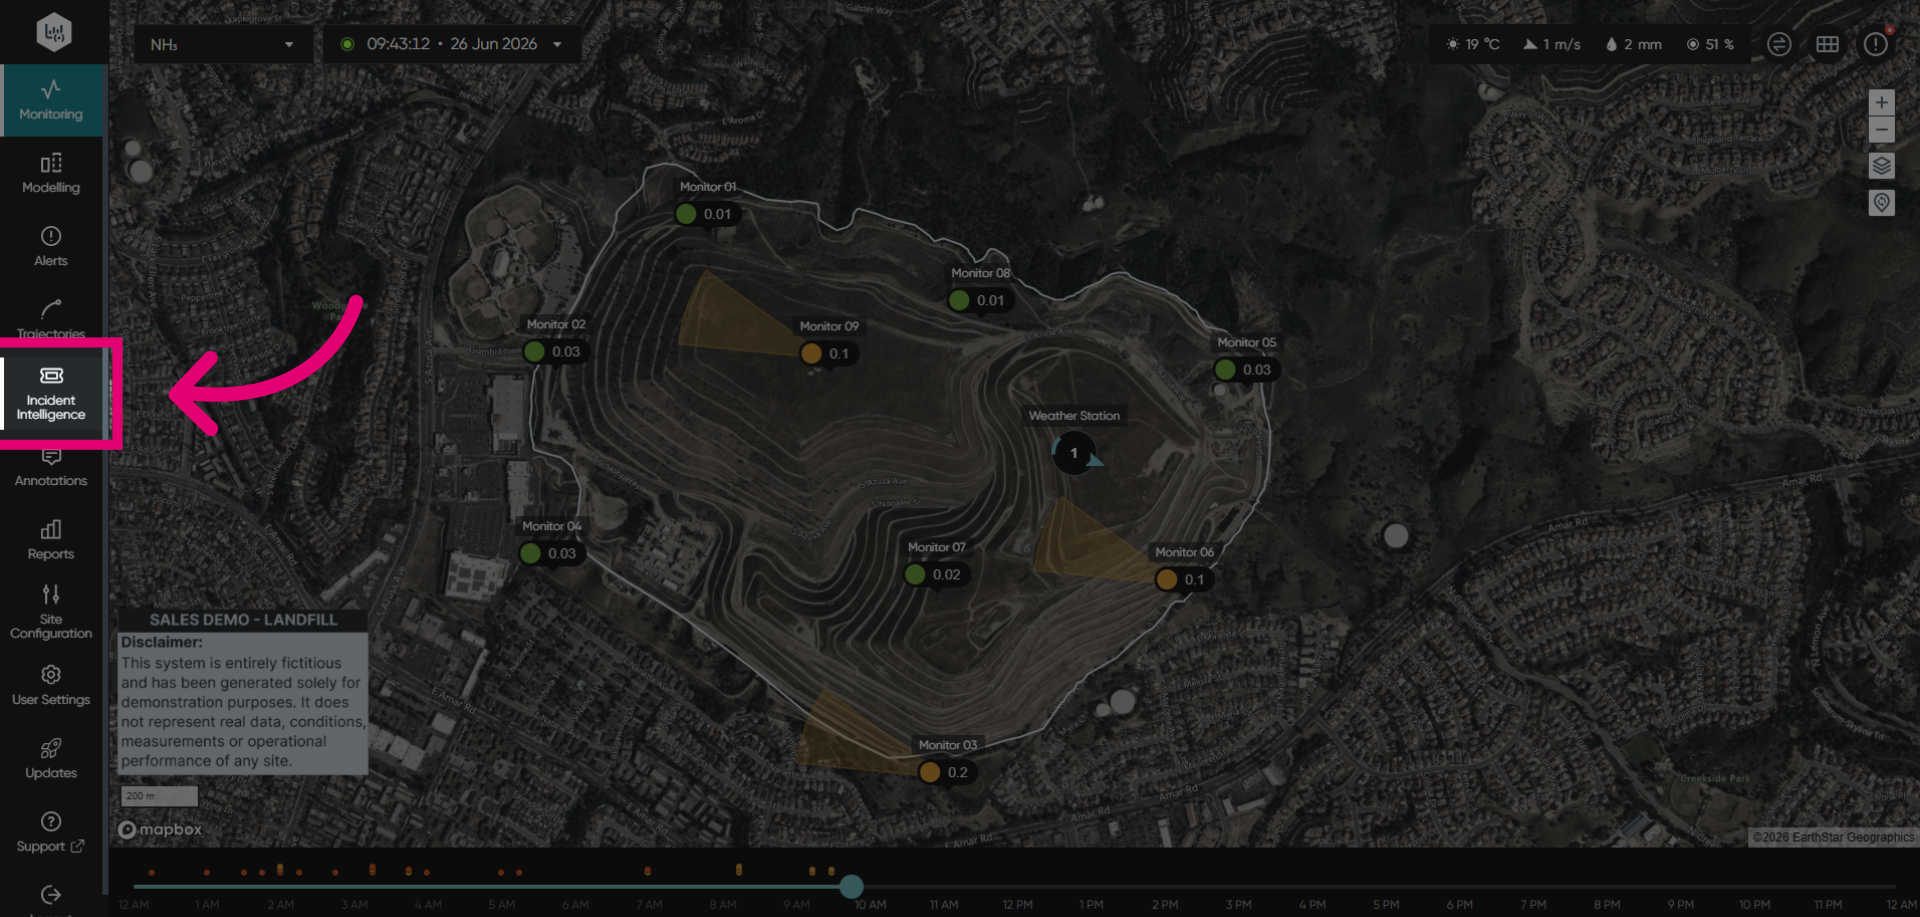
Click Incident Intelligence to open the incident analysis section within Ideagen Envirosuite.
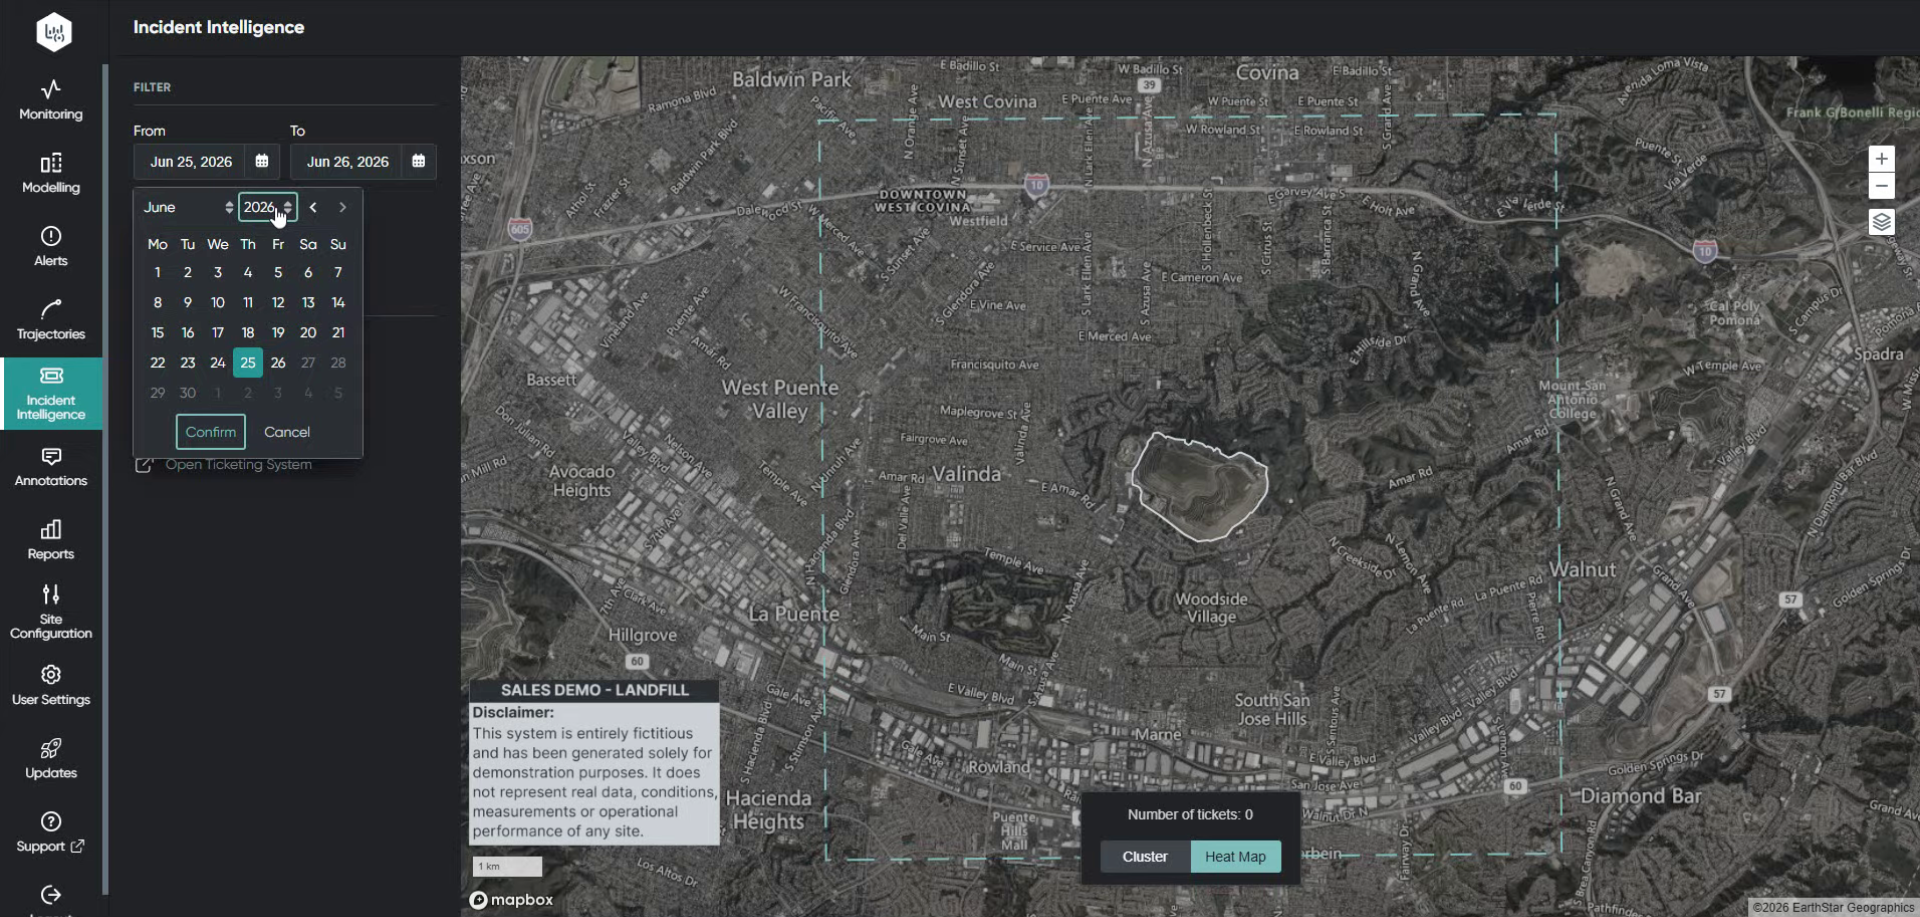
Click the data selection menu to choose specific data ranges for your start and end dates.
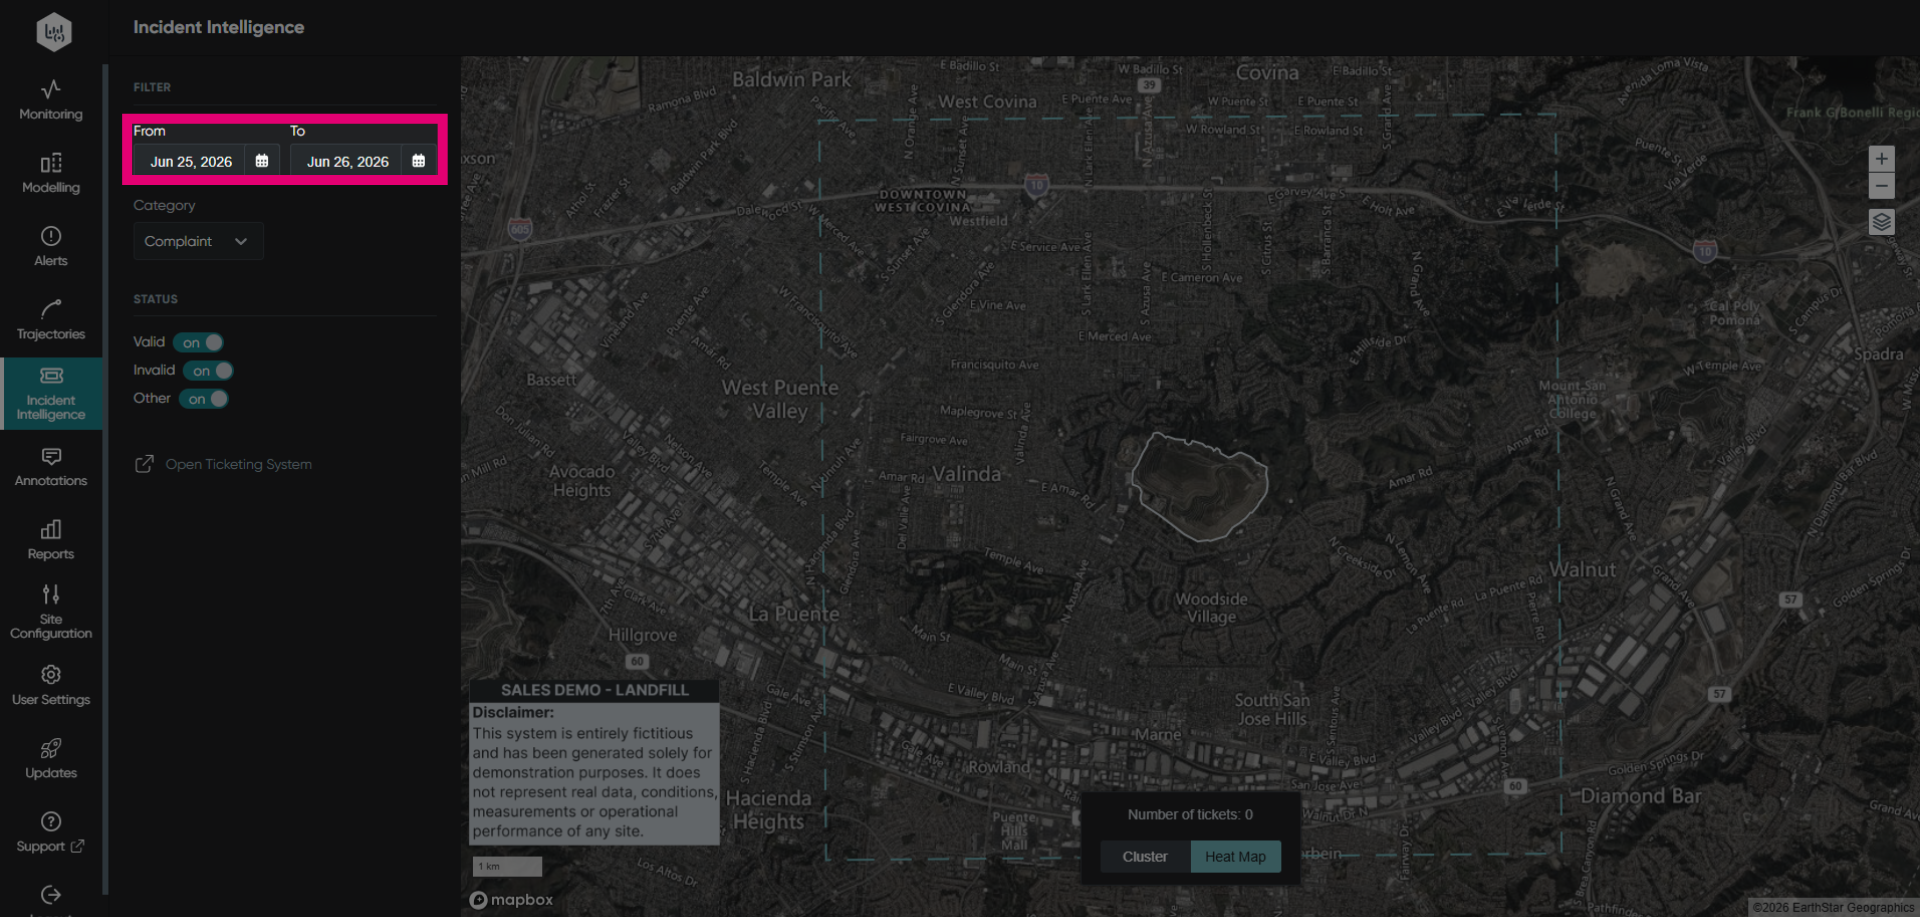
Fill the field with the desired data range to define the period for viewing resolved tickets from the complaint management tool.
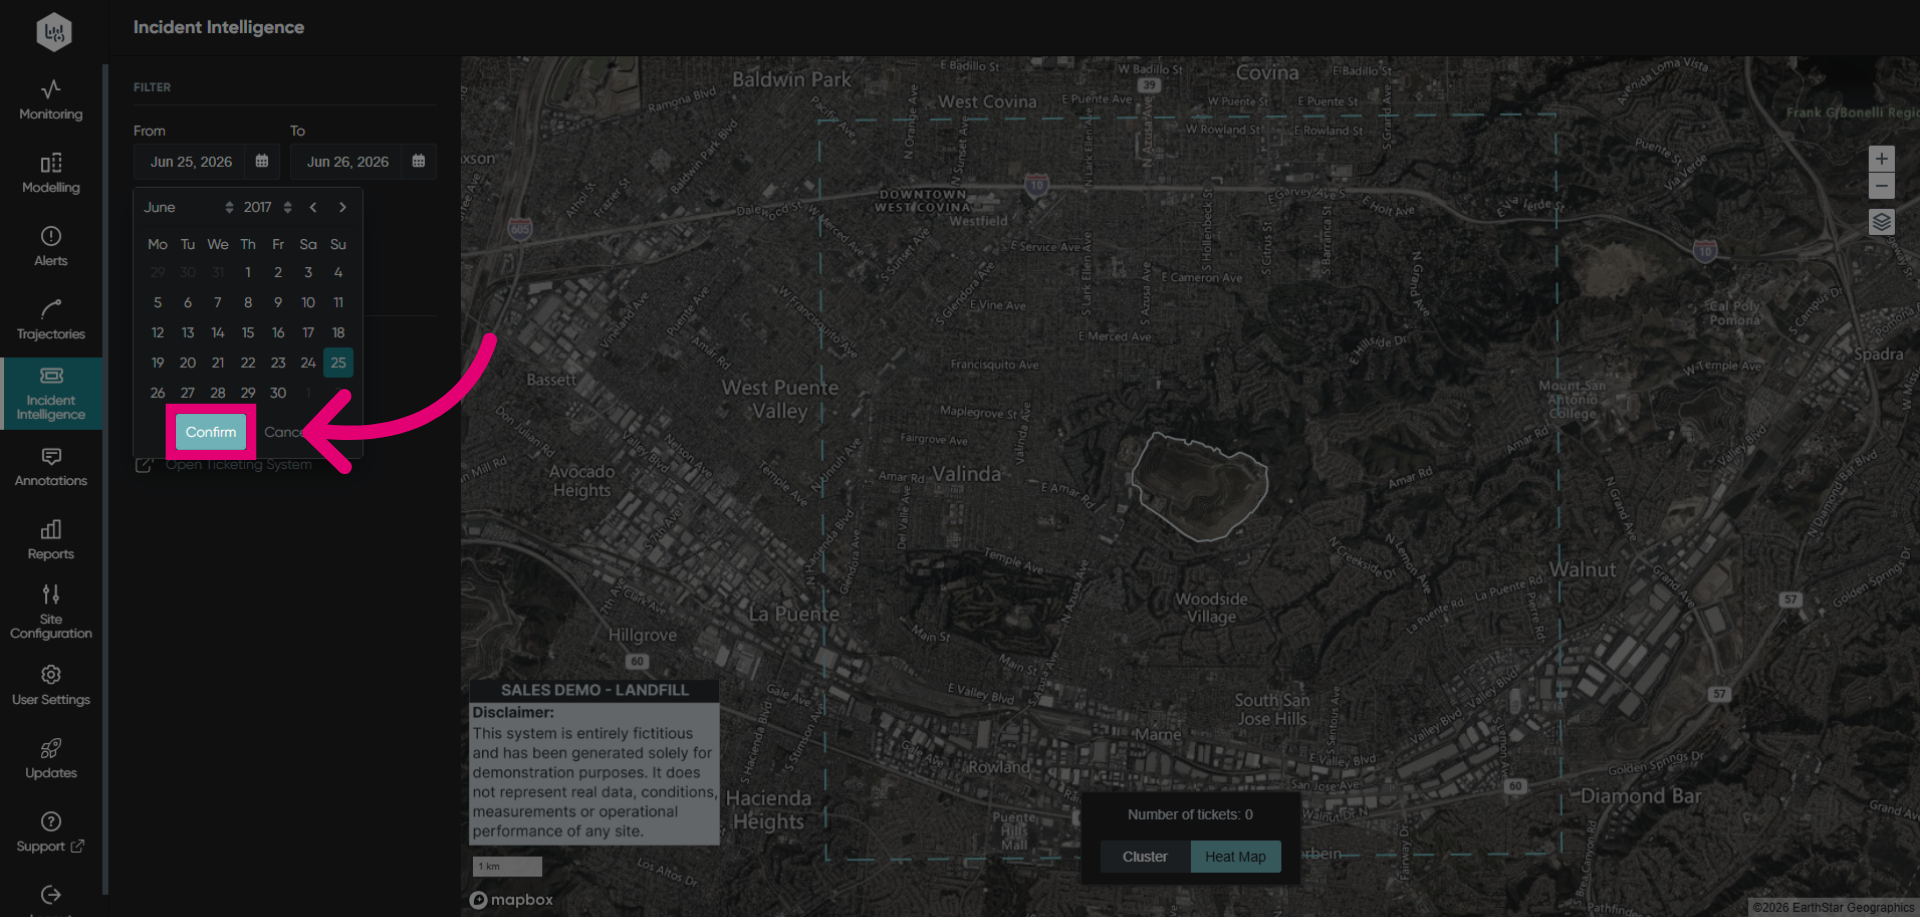
Click Confirm to apply the selected data range and proceed with the analysis.
Click Heat Map to visualize the resolved ticket data geographically within incident intelligence.
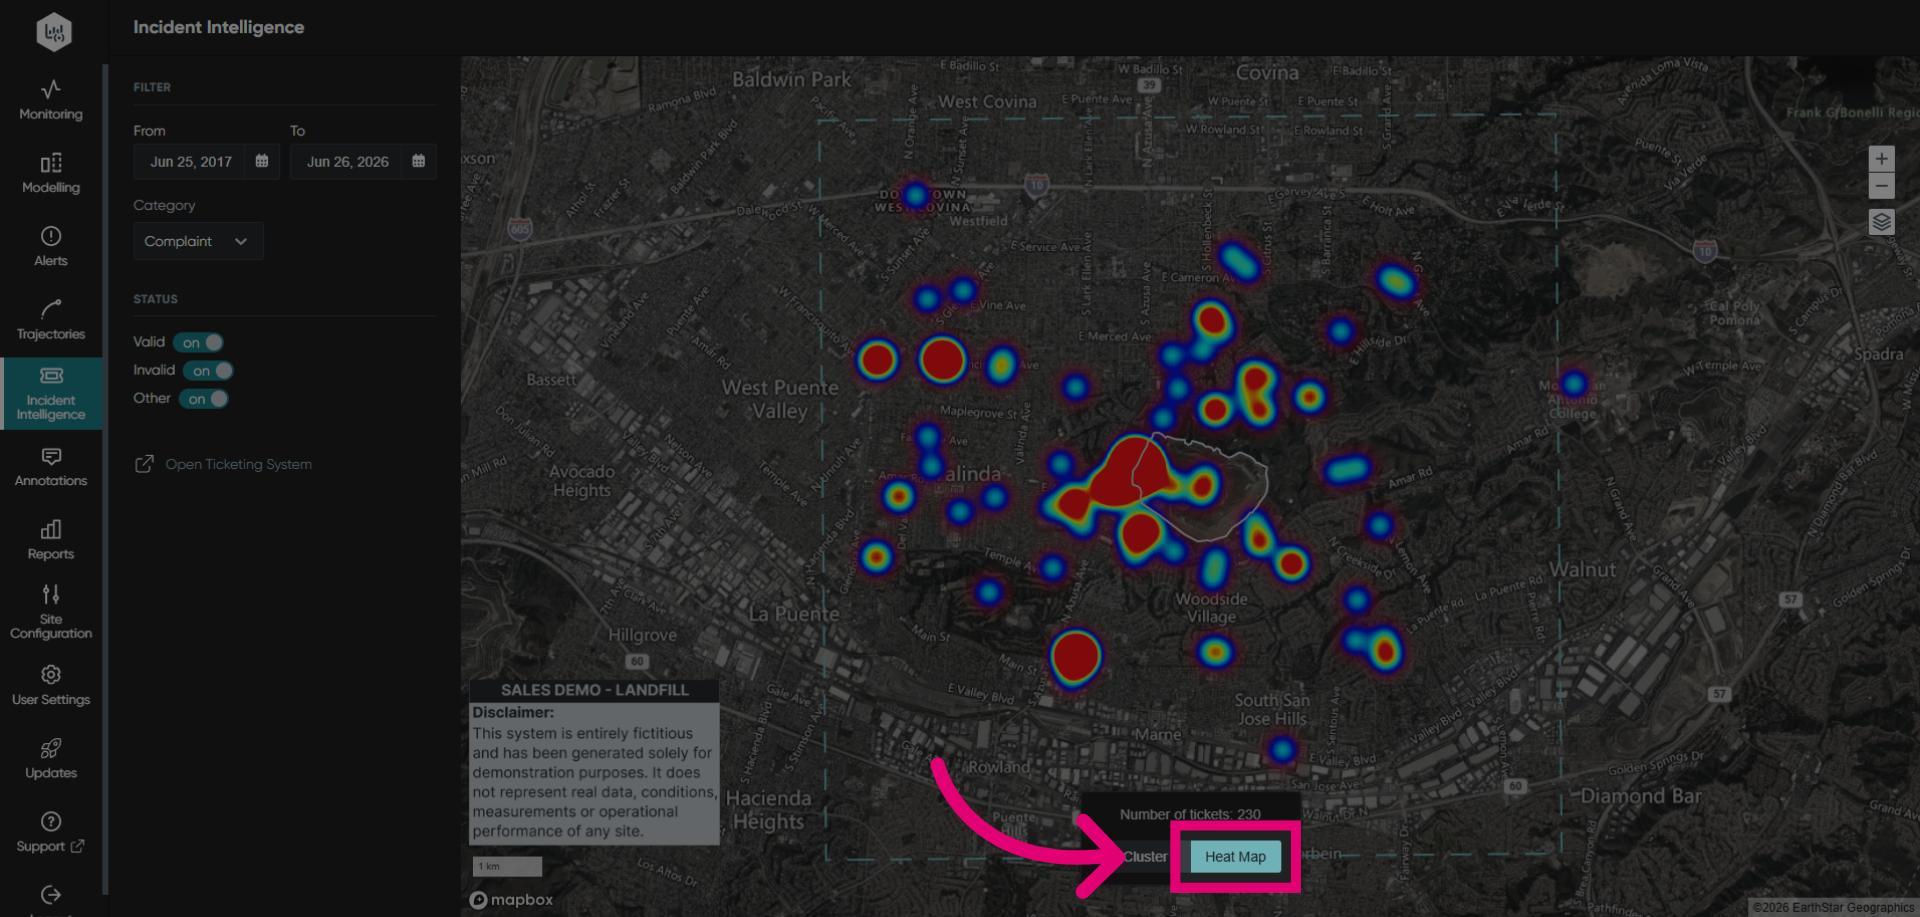
Zoom in and out to refresh the heat map for detailed nuisance issue insights.