


New article
Recently updated
Viewing incident intelligence data

Who is this article for?
User looking to visualize community observation data of nuisances.
Incident Intelligence module is required.
Incident Intelligence is part of a complaints package that automatically tracks community complaints about odours or air pollution, recording the location, date, and time when reported via hotline or similar services.
Knowing the incident location and time allows mapping of hotspots, helping stakeholders identify and address trouble areas or odour sources in the community.
This article explains where you can access and review this data.
Viewing incident data
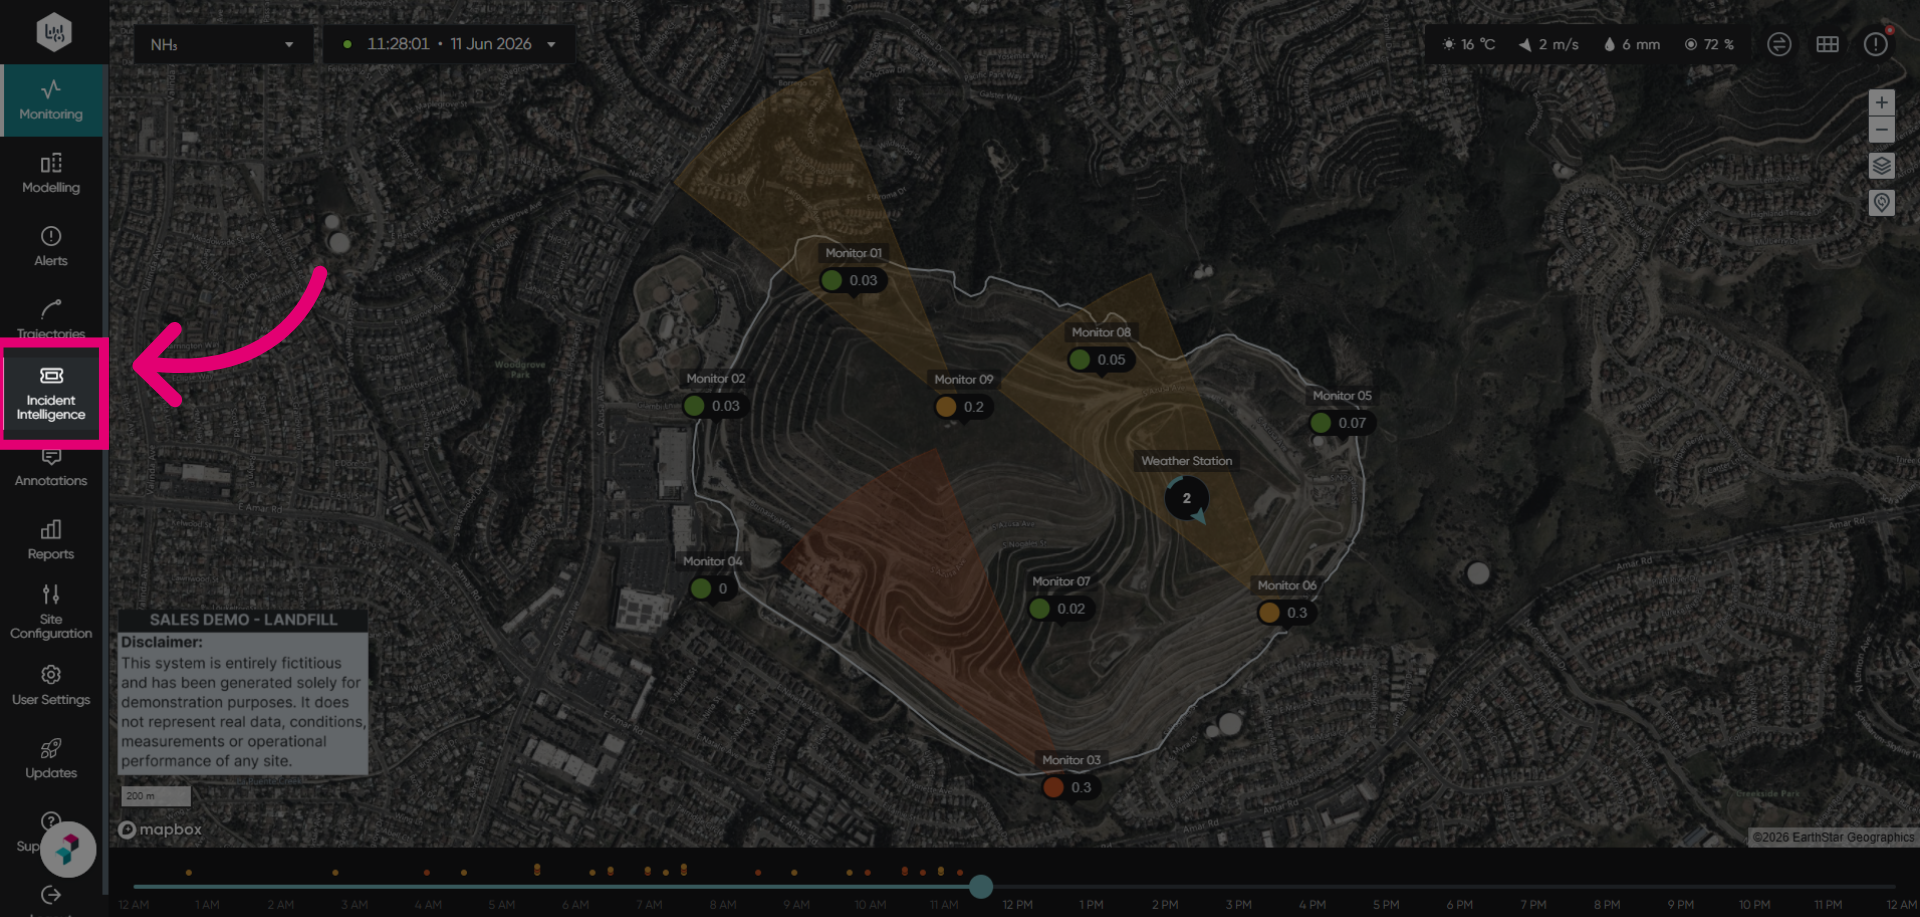
- Select Incident Intelligence from the module list on the left.
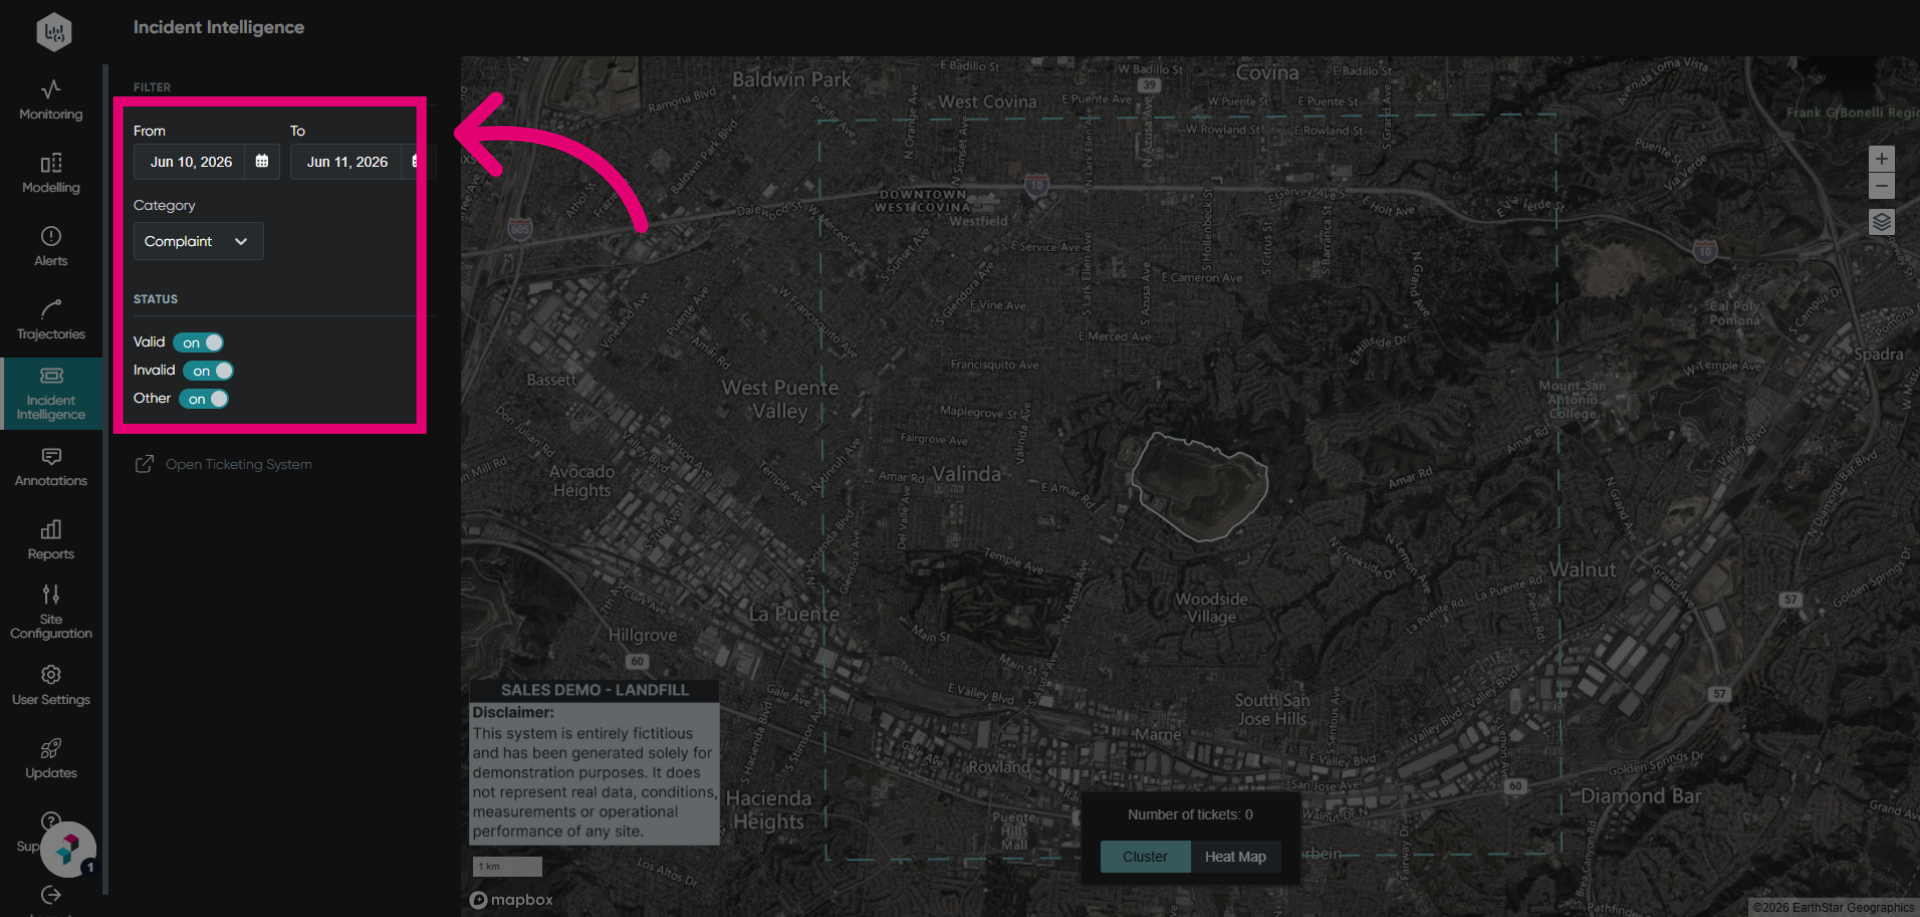
- Choose the From and To dates.
- Select the Category.
Complaints are displayed by default.
Note
The map will update after the first date pick action.
Reading incident data
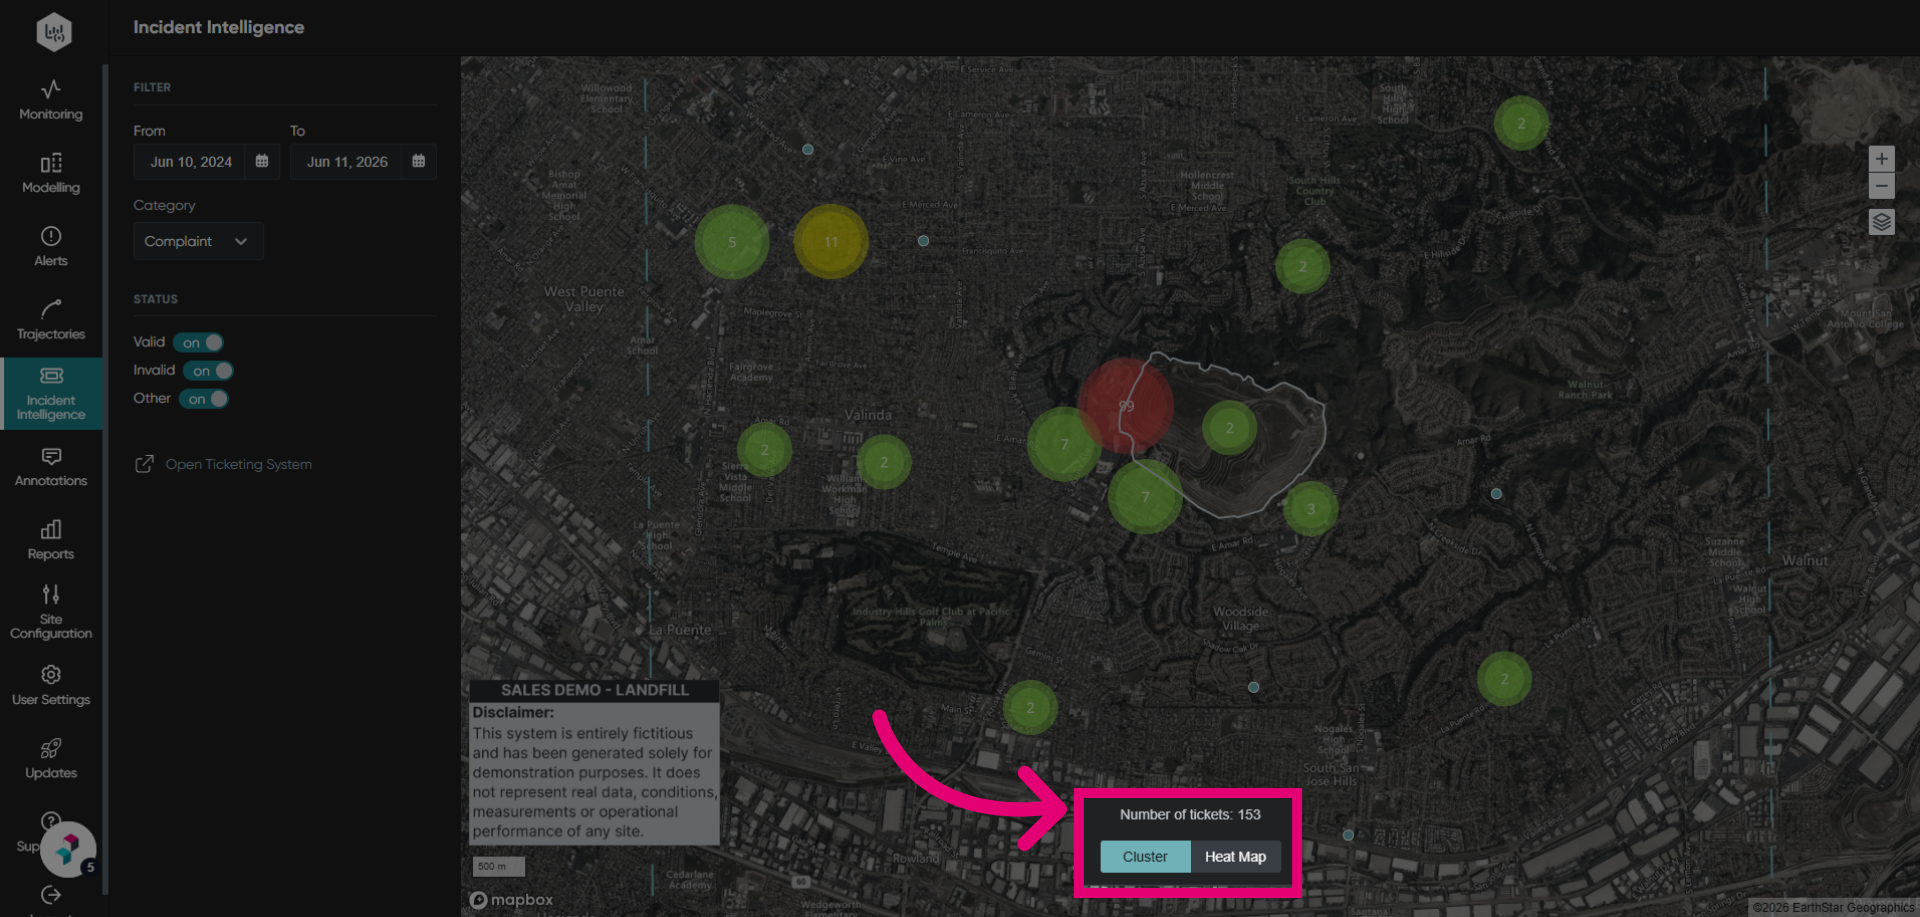
The map is a simplified version of the Monitoring map. By default it will show a heat map of where complaints have occurred.
You can switch between Cluster and Heat Map views as needed.
Note
Zooming in or out on the map will also change how both the heat map and cluster views are displayed.
Using this data, you can then proceed to make informed decisions about how to address significant or recurring issues.